Abstract
Direct air carbon capture and storage (DACCS) has the potential to contribute to meeting long-term climate goals. An ambitious deployment scenario shows DACCS growing rapidly to remove about 400 MtCO2 per annum (p.a.) by 2050, the equivalent of a little over 1% of 2022 emissions from the energy and industry sectors, and reaching one Gigatonne p.a. of removals before 2060.
However, achieving this scale of deployment will be enormously challenging, requiring strong, long-term policy support, and commitment of very large-scale physical and financial resources. Reaching Gigatonne scale is likely to require cumulative funding globally into the trillions of U.S. dollars. As part of this, a Gigatonne of DACCS will need 1400-4200 TWh p.a. of low carbon energy, which compares with U.S. utility scale power generation of 4240 TWh in 2022, and enough geological storage capacity to accommodate an amount of CO2 more than an order of magnitude greater than is captured each year for storage at present.
DACCS is currently in the early stages of deployment and uncertainties on costs are correspondingly large. Removals from early full-scale plants coming online towards 2030 currently appear likely to cost $400-1000 per tonne of net CO2 removed from the atmosphere. Costs may fall to around $200-400/tCO2 sometime in the 2050s if large-scale deployment is successful. However, costs towards $200/tCO2 only appear achievable if costs of early projects are towards the bottom of the expected range and there is large-scale roll-out of DACCS. Aspirational goals of DACCS costs of $100/tCO2 seem unlikely to be achieved even in the longer term. Costs of DACCS may nevertheless be below the costs of abatement in some applications.
Early deployment of DACCS is essential for reducing costs to enable timely deployment at scale. This outcome would probably best be supported by a combination of capital subsidies and contractual payments or tax credits. In the medium to longer term, removals may realize value by inclusion in emissions trading systems.
The challenges of implementing DACCS at very large scale further emphasize the need for urgent and widespread action to reduce emissions, which should continue to be the main priority for meeting climate goals. Such action includes decarbonisation of electricity grids and, where appropriate, use of CCS with high capture rates for industrial emissions.
1. Introduction
1.1. The Need for Large-Scale Permanent Carbon Dioxide Removal
Meeting international goals for limiting climate change will likely require removal of carbon dioxide from the atmosphere (carbon dioxide removal, CDR) as part of a wider programme of action.1 The main priority for action must be to reduce and, wherever possible, eliminate emissions. Preventing greenhouse gases entering the atmosphere will usually be easier and less costly than removing them once they are there. However, even if reductions are maximised, CDR looks likely to remain necessary for:
- balancing residual emissions that are impractical or too costly to abate (“hard to abate”), so as to achieve net zero emissions; and
- achieving net negative emissions globally in the longer term, and thus reducing atmospheric concentrations of carbon dioxide.
CDR will likely eventually be needed at large scale. For example, among “hard to abate” sectors, aviation has already grown to emit around one billion tonnes of CO2 p.a.2 Demand for aviation is expected to continue to grow significantly over the next few decades. New low-carbon technologies may provide partial solutions for reducing aviation emissions, including the use of hydrogen and electricity on shorter flights and carbon-neutral or carbon-negative biofuels for longer flights. However, aviation may still require substantial amounts of CDR to balance remaining emissions of aviation fuels in use, at least over the next several decades.3
In addition, several billion tonnes of removals each year are eventually likely be required globally to achieve objectives for limiting climate change. For example, modelling by the IPCC shows that in a mid-case scenario around 10 billion tonnes or more of removals each year will be needed in the second half of this century to limit global mean surface temperature rises to 1.5 degrees.4
1.2. Options for Removals and the Role of DACCS
A variety of technologies and practices have the potential to contribute to CDR. These include direct air carbon capture and storage (DACCS), bio-energy with carbon capture and storage (BECCS), land use changes, including afforestation, the large-scale use of biochar, soil carbon sequestration, ocean fertilisation, and enhanced weathering. Each of these approaches faces different challenges. For example, they differ greatly in their readiness for deployment, current and potential scale, ease and accuracy of measuring removals, duration of removals, risks of reversal, and effects on communities, biodiversity, and use of other resources.
It is too early to determine what mix of removals will prove to be optimal. However, relying on removals to biogenic sinks such as forests to meet climate goals presents significant risks. Carbon stored in biogenic sinks may be released back into the atmosphere (a reversal). Such reversals could happen systemically, for example through large-scale die-back of forests, making the removals that have been lost difficult or impossible to replace. If this were to happen on a large scale, the amount of carbon in the atmosphere would exceed required levels, and climate targets would not be met.
Consequently, removals to biogenic storage cannot reliably balance emissions of fossil carbon, proportions of which remain in the atmosphere for centuries. Furthermore, there are limits to the scale of biogenic sinks, for example due to the need to safeguard biodiversity. Partly in recognition of limits on biogenic removals, the EU has adopted separate targets for emissions reduction and land use.5
In contrast, DACCS places CO2 into geological sinks which provide permanent storage, with very low risk of reversal, provided that the sinks are adequately managed so that leaks are avoided. This enables DACCS to reliably balance residual emissions of fossil carbon. Assessments of policy options have increasingly recognized the need to balance remaining emissions of fossil carbon with removals into geological storage (“geological net zero”),6 for example as part of a Carbon Takeback Obligation,7 in order to reliably achieve long-term climate goals. In line with such considerations, proposed legislation in California8 (SB308) would require emitting entities to purchase increasing amounts of long-term negative emission credits to counterbalance their emissions.9
BECCS also provides permanent storage in geological sinks. It has the advantage, compared with DACCS, that it captures a more concentrated CO2 stream, because growing the biomass has already concentrated the carbon from the air. This may make projects more tractable and cheaper. BECCS may also produce useful energy, including as biofuels, while remaining a net remover of CO2 from the atmosphere on a lifecycle basis. Some BECCS projects are likely to be able to make use of existing biogenic feedstocks, such as the biogenic element of municipal waste.
However, total bio-energy resources are likely to be significantly constrained.10 Like biogenic sinks, they may compete for land and potentially adversely affect biodiversity. In contrast, there do not appear to be any fundamental resource constraints limiting the scale of DACCS. However, infrastructure requirements, notably for sinks and energy supply, will be large if DACCS is to contribute significantly to reaching climate goals.
1.3. Applying DACCS
The potential to provide large-scale, permanent carbon dioxide removals has led to
substantial interest in DACCS from governments and project developers.
Direct air capture (DAC) technologies capture CO2 from the air and compress it to produce a denser stream of CO2. After capture and compression, the CO2 can be transported, usually by pipeline or ship, and injected into a geological formation deep underground, usually a saline formation or depleted oil or gas field.
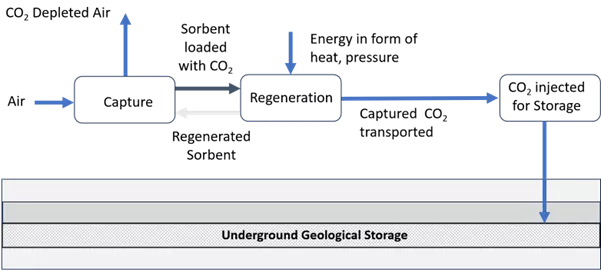
A range of technological approaches to DAC are currently under development (see Appendix). The more well-developed ones have similar steps in common (see Figure 1). Air is first introduced and brought into contact with a sorbent (liquid absorbent or solid adsorbent) where the CO2 is captured, and then heat is applied (“temperature swing”), or pressure is lowered (“pressure swing”) to release the CO2. This CO2 is then pressurized for transport and storage.
The main difference between DAC and CO2 capture from an exhaust stream from power generation or industrial plants is the low concentration of CO2 in the atmosphere. The concentration of CO2 in the atmosphere is about 410 ppm, or 0.041%. Typical concentrations of CO2 in exhausts from burning gas are about a hundred times greater at about 4%, and greater still in exhausts from burning coal. The much lower concentration of CO2 makes capture from the air more expensive than capture from industrial exhaust streams.
The low concentration of CO2 in the atmosphere means that the volume of air that must be processed to remove one tonne of CO2 is huge. To remove one tonne of CO2, a DAC plant must process about 1.8 million m3 of air with 75% capture of CO2.11
DAC plants also require significant amounts of land. They will likely not be a single unit, but broken down into multiple smaller units,8 analogous to a wind farm made up of multiple wind turbines. The land required to space out air contactors for a million tCO2/year DAC facility has been estimated to be in the range of 1–7 km2. These estimates exclude the land required for renewable energy to power the plant, which is typically the largest component of land needed. However, land requirements will usually be considerably smaller than land-based removals such as afforestation.
1.3.1. The Importance of Low-Carbon, Baseload Energy Supply
The energy requirement for DACCS is also substantial. In practice, the amount of energy required to capture one tonne of CO2 from the air is likely to be in the range 5-15 GJ (1.4-4.2 MWh), including electricity to compress the CO2 for transport and storage. This implies a million tonnes of DACCS would require 1.4-4.2 TWh of energy, with a Gigatonne of removal requiring 1400-4200 TWh.
If the DACCS project is to result in effective net removals from the atmosphere, then the energy for DACCS must come from low-carbon sources. If the energy is not from low-carbon sources, then emissions from energy production reduce the net removal from the atmosphere, and may even result in net emissions.
This requirement for low carbon energy creates difficulties if electricity is supplied to the DACCS project from a grid system that is not fully decarbonised. On many grids at present, additional electricity demand must almost always be met by fossil generation without CCS. Renewables generators will usually not be able to increase their output from present capacity, because they will usually already be running at maximum output, as their running costs are very low. In these circumstances, adding extra electricity demand by running DACCS plant leads in practice to increased generation from fossil fuels, and the associated emissions. These difficulties emphasise the necessity of decarbonising grids if DACCS is to be effective at securing net removals while using power from the grid.
Low-carbon energy is likely to be wind and solar in most cases, but may also include fossil plant with CCS or nuclear. Nuclear may benefit from its ability to provide both electricity and heat, but costs appear likely to be high. For early projects it may be possible to obtain energy in the form of waste heat from other industrial processes. However, this is likely to become less prevalent over time as electricity comes increasingly from renewables, industrial production become increasingly electrified, and the scale of DACCS deployment grows.
DACCS is capital-intensive so there will be an economic imperative to operate the plant at high load factor (e.g. around 90%, or 8000 hours per year), although amounts of CO2 captured will likely vary somewhat in any case with differences in efficiency between day and night and across seasons.
However, there will be challenges in managing energy supply to power the plant to enable high load factor operation, because renewable energy production is intrinsically variable. Where electricity is from dedicated production, for example of solar PV, there may be a need to store the electricity, at least from day to night. Some of the energy storage may be in the form of heat. Alternatively, low-carbon baseload electricity may be provided by the grid as a service (where available).
1.4. Current Status of DACCS Deployment
Despite the widespread interest, the development and deployment of DACCS is currently in its early stages. Work by the IEA showed that in 2022 there were 18 DAC plants operating. These were removing less than ten thousand tonnes of CO2 per year globally.12 These plants are located in Europe, the United States and Canada. All of these plants are small-scale, and the large majority of them capture CO2 for utilization, for example for drinks carbonation, with only two plants storing the captured CO2 in geological formations for removal. Only a few commercial agreements are in place to sell or store the captured CO2, while the remaining plants are operated for testing and demonstration purposes.
Plans for at least eleven DAC facilities are now in various stages of development. One of these is a large-scale DAC plant of 0.5 MtCO2 p.a. under construction in the United States and scheduled to be operating by the end of 2025.13 It is understood to have the potential to expand to 1 MtCO2 p.a. The U.S. Department of Energy has recently announced funding for this and a second project of approximately 1 MtCO2 p.a. in Louisiana.
If all planned projects were to go ahead on their currently planned schedule, DAC deployment would reach around 5.5 MtCO2 p.a. by 2030. This is more than 700 times today’s capture rate, but less than 10% of the level of deployment needed to get on track with the IPCC’s Net Zero Scenario. Much more will be needed over time if DACCS is to have a material influence on the climate.
1.5. Objective and Limitations of This Work
The objective of this work is to examine the costs and prospects for DACCS, and to identify types of funding needed for early deployment for DACCS, building momentum for later widespread deployment.
This work is limited by the very early stage of DACCS deployment. This means that uncertainties on costs and technologies are large, with cost estimates differing by a factor of two or more.
The work does not include detailed examination of different technologies, or comment on which technologies will eventually be preferred. Some estimates indicate that different technology choices can lead to large differences in costs, and this possibility may strongly influence where eventual outcomes lie. We consider the extent to which innovation might reduce costs, but we exclude any fundamental technological breakthroughs. We also do not explore any potential engineering limits on cost reduction, which remain unknown.
This work also excludes comparison of specific alternative possible locations for DACCS. Regulatory frameworks and incentives are also in their early stages, so we do not review legislation in detail.
Instead the work here is intended to give an overview of the potential for future deployment of DACCS and the contribution such deployment may make to meeting climate goals.
1.6. The Priority of Emissions Reduction
We emphasise that, while removals are likely to play an important role in limiting climate change, the main priority must continue to be reducing emissions wherever possible, especially emissions of CO2 from fossil carbon, and of other long-lived greenhouse gases. It will almost always be preferable to prevent carbon getting into the atmosphere than to remove it once it is there. Indeed, the costs and challenges of achieving very large-scale deployment of DACCS that are described here further reinforce the case for urgent, large-scale emissions reductions.
The priority given to emissions reduction over removals is especially pressing as long as electricity grids are not fully decarbonised. While it is important to build enough full-scale DACCS plants to achieve scale and significantly reduce costs, this effort should not detract from achieving emissions reductions from the electricity grid. It will generally be more cost effective to use any additional renewable electricity to displace remaining unabated coal or gas in power generation, and to enable the deployment of highly efficient electricity end use applications, such as electric vehicles and heat pumps, than to power DACCS. There may be some opportunities for DACCS where there are no alternative uses for the renewable electricity. However, these will likely be few, given the potential for long distance electricity transmission.
Emissions reductions should, where appropriate, include CCS for industrial processes. In addition to its greater cost effectiveness than DACCS, because of the higher concentrations of CO2 for capture, early deployment of CCS can help build CO2 transport and storage infrastructure that will be needed for DACCS.
In deploying CCS in industry there should be a strong imperative towards increased capture rates to reduce residual emissions. Although there will be an extra cost and energy requirement for higher capture rates, this approach is likely usually to remain lower cost than using DACCS to subsequently remove those residual emissions from the atmosphere.
2. Current Costs of DACCS
One of the largest barriers to deployment of DACCS is the high cost per tonne of CO2 removed from the atmosphere. In this section, we examine the current costs of DACCS. The potential for future cost reductions is assessed in the next section.
2.1. The Large Uncertainties and Variations in Costs of DACCS
2.1.1. Uncertainties, Variations and Bias in Costs for Early Plants
Costs of DACCS are highly uncertain at present, because DACCS is in the early stages of its development and deployment, with a lack of experience of building large-scale capture plants. One consequence of the current stage of deployment is that there may be systematic biases in estimates. Studies have found a typical pattern of initial underestimations of costs, followed by higher realised costs for First of a Kind (FOAK) plants as unanticipated issues are addressed, then falling costs for Nth of a Kind (NOAK) plants as experience accumulates.
In addition to uncertainties, there are wide variations in costs arising from, for example, different choices of technology and design, especially for early projects. Differences in availability and costs of low carbon electricity can also substantially affect costs.
Even two identical plants built in different locations may have large cost differences per tonne of removals, because of differences in component costs such as land. Rubin et al.14 document dozens of variables that should be included in estimating costs, including energy costs, cost of capital, plant location, plant size, and whether it is for a plant built today or sometime in the future.
2.1.2. Basis of Cost Estimates
We have estimated costs of DACCS on the following basis.
Estimates are based on costs per net tonne removed
To determine cost effectiveness for limiting climate change, estimates of costs of DACCS in $/tCO2 need to take account of any emissions from building and operating DACCS projects, including emissions of other greenhouse gases such as methane. This principle requires a full life-cycle assessment (LCA) of the carbon balance of the process.
While some studies attempt that, most appear to report the costs as $/t of gross CO2 removed from the air. This overstates the climate benefits of the removal. Among other things, this approach potentially distorts comparisons of the costs of emissions reductions and other removals. Where appropriate we make an adjustment to convert costs calculated on a gross basis and a net basis.15
Work by the IEA estimates that the lifecycle emissions associated with DACCS range from 7-17% of the CO2 captured for FOAK plants and 3-7% for NOAK plants (if low-carbon energy is used).16
Of particular importance are emissions from producing electricity and heat to power the DACCS process. If energy sources are not low carbon, then the emissions from producing energy to run the DACCS process can reduce or eliminate the net removals from the atmosphere due to a DACCS project. As noted above, this is likely to present problems if projects use electricity from grids which are not fully decarbonized.
Costs are in $2023
Cost estimates allow for general inflation and are expressed in $2023. Costs modelled in previous years are escalated using a U.S. dollar producer prices index.
This paper looks at the longer term. Consequently, short- to medium-term fluctuations in costs are excluded. For example, some costs may currently be high due to supply chain bottlenecks or other factors, but may reverse relative to general inflation over a period of decades.
Transport and storage costs are included
Total costs include transport and permanent storage of the CO2, because this is an essential part of the process of permanent removal using DACCS. They do not include any allowance for revenue from enhanced oil recovery (EOR).
2.2. Current Estimates of Costs of DACCS
To address the variations and uncertainties in the costs of DACCS, we have examined a range of evidence, including:
- estimates of costs reported in the published literature, which we have attempted to put on a common basis;
- evidence from early projects, which remains sparse and limited;
- discussions with industry participants and observers; and
- evidence from CCS projects, which have transport and storage costs in common and some comparability in type of technology for the capture plant.
Nevertheless, the current extent of variations and uncertainties means that ranges on cost estimates are necessarily wide, sometimes differing by a factor of two or more.
2.2.1. Estimates from Published Literature
The Intergovernmental Panel on Climate Change Special Report Global Warming of 1.5°C (IPCC SR1517) sums up what the literature says about DAC costs as follows: “However, the literature shows low agreement and is fragmented. This fragmentation is reflected in a large range of cost estimates: from $20–1,000/tCO2. There is lower agreement and a smaller evidence base at the lower end of the cost range.”
Fuss et al. (2018)18 narrow this range concluding: “Based upon our literature review, it appears that a first-of-a-kind plant may be on the order of $600–1000/tCO2 initially, but that as advances are recognized through the building of more plants, this cost may decrease to $100- 300/tCO2.”
A report by the IEA (IEA 2021)19 estimated FOAK DACCS projects are likely to range from approximately $400-$700/net-tCO2, when global average solar photovoltaics (PV) costs are used, or approximately $350-$550/net-tCO2, when lowest-cost renewables are used. Energy costs are estimated to be as much as 50% of long-term liquid DACCS costs.
T he IEA’s work suggests significant cost reduction can be achieved for NOAK DACCS plants, reaching $194-$230/net-tCO2 for 1 MtCO2/year scale, driven by reduced electricity prices as costs of renewable electricity generation continue to fall, lower cost of capital, and lower upfront capital investment. NOAK DACCS costs in the range of approximately $150-200/net-tCO2 may be achieved if very low-cost solar energy is used. Long-term costs were found to be significantly higher than the industry target of $100/tCO2 captured, except under ambitious cost-performance assumptions and favorable conditions.
Modelling by Element Energy for the UK Government highlights the potential importance of technology choices. It suggests a possible FOAK levelized cost for DACCS of £453/tCO2 ($590/tCO2) for hybrid solid DACCS plants and £318/tCO2 ($410/tCO2) for hybrid liquid DACCS plants. This suggests an increase of around 40% from choice of different technology.20
In Keith et al., Carbon Engineering has estimated cost numbers of $94-232/tCO2 and has provided the most supporting information of any DAC cost estimates presented to date. The numbers are based on detailed simulations with a very transparent listing of the input parameters. However, the resulting estimates are much lower than others.
In contrast, Exxon has stated costs are $600-1000/tCO2.21 Herzog has also estimated costs of $600-1000/tCO2 in 2030.11
Figure 2 summarizes these cost estimates from the literature, showing low (blue bars) and high (grey bars) ends of the range. We have attempted to put these on a common basis by adjusting for:
- inflation, to recognize the different dates of estimates;
- converting from gross to net costs per tonne, assuming lifecycle emissions have been excluded from estimates unless otherwise stated; and
- allowing for transport and storage costs where these are excluded.
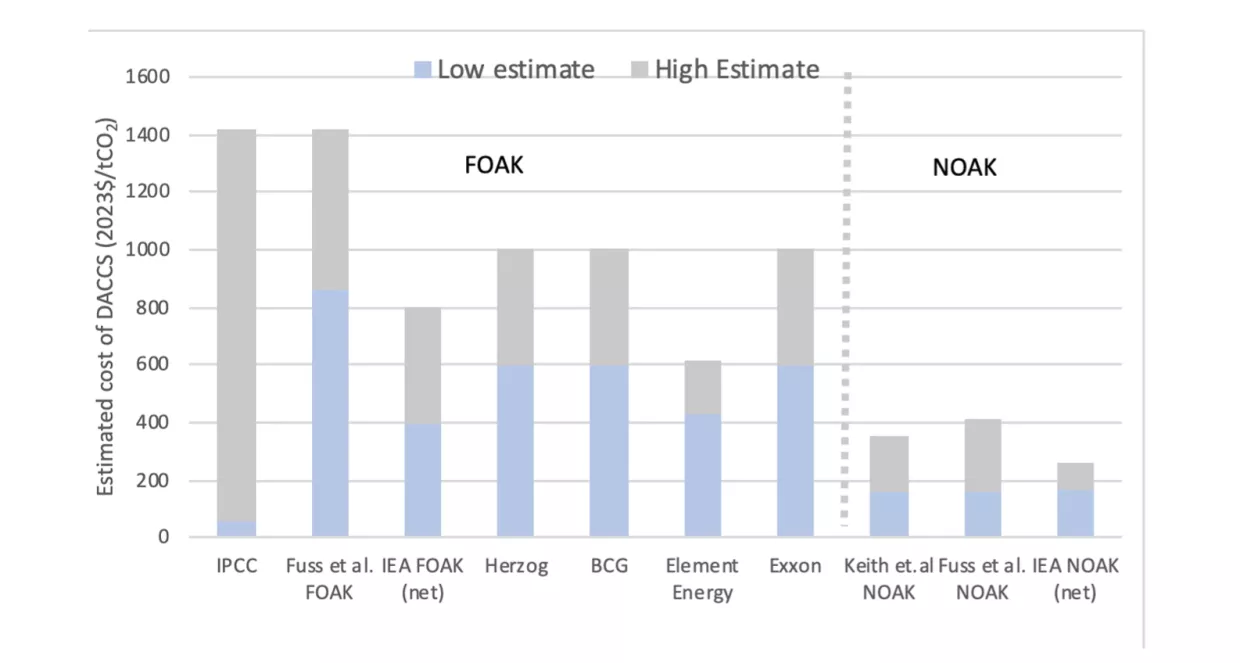
Costs quoted elsewhere may appear lower, even though underlying costs are the same. For example, quoted costs may be on a gross rather than net tonnes basis, or may not be in $2023.
2.2.2. Evidence from Project Developers
Several start-up companies are trying to commercialize DAC using processes based on chemical absorption or adsorption. Two of these, Climeworks and Carbon Engineering, are already at an advanced stage.
Climeworks’ facility in Iceland is currently the only project with a contracted price for negative emissions from DACCS. The price is understood to be around $1100/ tCO2. However, this is a price associated with a single small facility (4000 tCO2 p.a.), which is unlikely to directly represent the costs of a full-scale facility 100 times or more the size. The price may differ from costs, further limiting its value as a cost reference point.
Climeworks has reported the cost of their DAC unit in Switzerland to be $600/tCO2.22 However, the information to put this number in context is limited. Compression and storage costs are not included, as the captured CO2 is piped to an adjacent greenhouse at atmospheric pressure. The projected cost for their 36,000 tCO2/year plant under construction in Iceland is reported to be $700/tCO2.23
Other projects’ views of costs are more optimistic. The U.S. Government has targeted $100/ton. Project developer Carbon Capture has said it expects to hit $250 per ton by 2030 and $150/ton within a decade.24 The evidence supporting such estimates seems comparatively weak. They may include substantial appraisal optimism typical of early-stage estimates.
2.2.3. CCS Costs as a Reference Point
Some market data is now emerging on the costs of industrial carbon capture. As part of the Longship CCS project in Norway, a capture plant is under construction at a cement manufacturer. This had an expected cost of €60-80/tCO2 captured25 ($66-88/tonne captured). Outturn costs are understood to be somewhat higher than this. There was an additional €90-110/tCO2 (USD 99-121) for transport and storage, leading to outturn total costs of approximately $200/tCO2. Norway is a high-cost location, so costs may be lower elsewhere.
The Global CCS Institute (GCCSI) has estimated costs of CO2 capture at different partial pressures of CO2, which correspond to different concentrations.26 It shows capture costs increasing from approximately $65/tCO2 to $180/tCO2 as the partial pressure of CO2 in the flue gas falls from 5 kPa to 1 kPA. Extrapolating this to the partial pressure of CO2 in the atmosphere, which is about 0.04 kPa, would imply very high costs. However, the GCCSI work does not extend to partial pressures of less than 1 kPa.
Other work has nevertheless shown the higher costs of capturing from dilute streams, estimating $1000/tCO2 for DAC.27
Based on these considerations, some of the lower estimates for the cost of DACCS described above appear improbable.
2.2.4. Discussions with Industry Participants
We have had conversations with industry participants to provide background information and insight for this study. They have tended to emphasise the large degree of uncertainty, the high costs of early plants, and the need for significant cost reductions.
2.2.5. Summary of Cost Estimates
On the basis of the evidence summarised above, we adopt for modelling purposes a range of costs for early full-scale DACCS projects of $400-1000/tCO2 in $2023. This includes the costs of transport and storage. It is a cost per tonne of net removals, taking account of emissions from building and operating the DACCS plant.
3. Future Deployment and Costs of DACCS
In this section, we consider possible future trends in costs taking account of:
- aggregate cost modelling based on deployment and learning rates, making comparisons with other technologies; and
- examination of cost components and potential for savings, which serves as a reality check on the modelling.
3.1. Modelling Costs as a Function of Deployment
Studies across a range of technologies have commonly found costs falling by a fixed percentage for each doubling of cumulative production.28 In this model, future costs depend only on:
- the costs of early plants, which provide a starting point;
- the learning rate, which specifies the constant percentage cost decrease for each doubling of cumulative deployment; and
- the scale of deployment now and in future.
The long-term trend may be subject to fluctuations. For example, during the mid-to-late 2000s, solar PV showed costs above the long-term trend of reduction, due to a shortage of appropriate grades of silicon, but costs subsequently reverted to trend.29
This single factor model captures a wide variety of drivers of cost reduction. These include, for example, standardizing supply chains, expanding the manufacturing base, and improvements in design and manufacturing of the technology. While some have argued that such an approach is simplistic for CCS technologies due to them being in their early stages,30 its proven robustness over a wide range of technologies and the small number of parameters required makes it a useful approach in cases such as DACCS where data is scarce and uncertainties are large.
A variety of multi-factor learning models have been developed which elaborate on the single factor model. While such models provide a more detailed account of the factors that affect the cost of a particular technology, they are not as prevalent in the literature as the single-factor model, owing in large part to data requirements and limitations.
In assessing the potential for cost reduction for DACCS, we have adopted the standard single factor approach, with a single learning rate cover all costs in aggregate. We have also examined sensitivities to this using a two-factor model where low-carbon energy costs are treated separately.31 Energy costs are a significant proportion of the total, and may show different trends from other costs. We have assumed use of renewable energy, typically solar but also wind. We also assume an increase in energy efficiency in future projects.
3.2. Learning Rates for Other Energy and Related Technologies
We estimate learning rates for DACCS by examining observed historical learning rates for energy related technologies. Although DACCS is not itself a technology for producing or carrying energy, it shares many characteristics with large-scale energy technologies, including extremely large potential scale globally, capital intensity, asset lifetimes of decades, and complexity of projects. Energy and related technologies thus provide a clear analogy with DACCS.
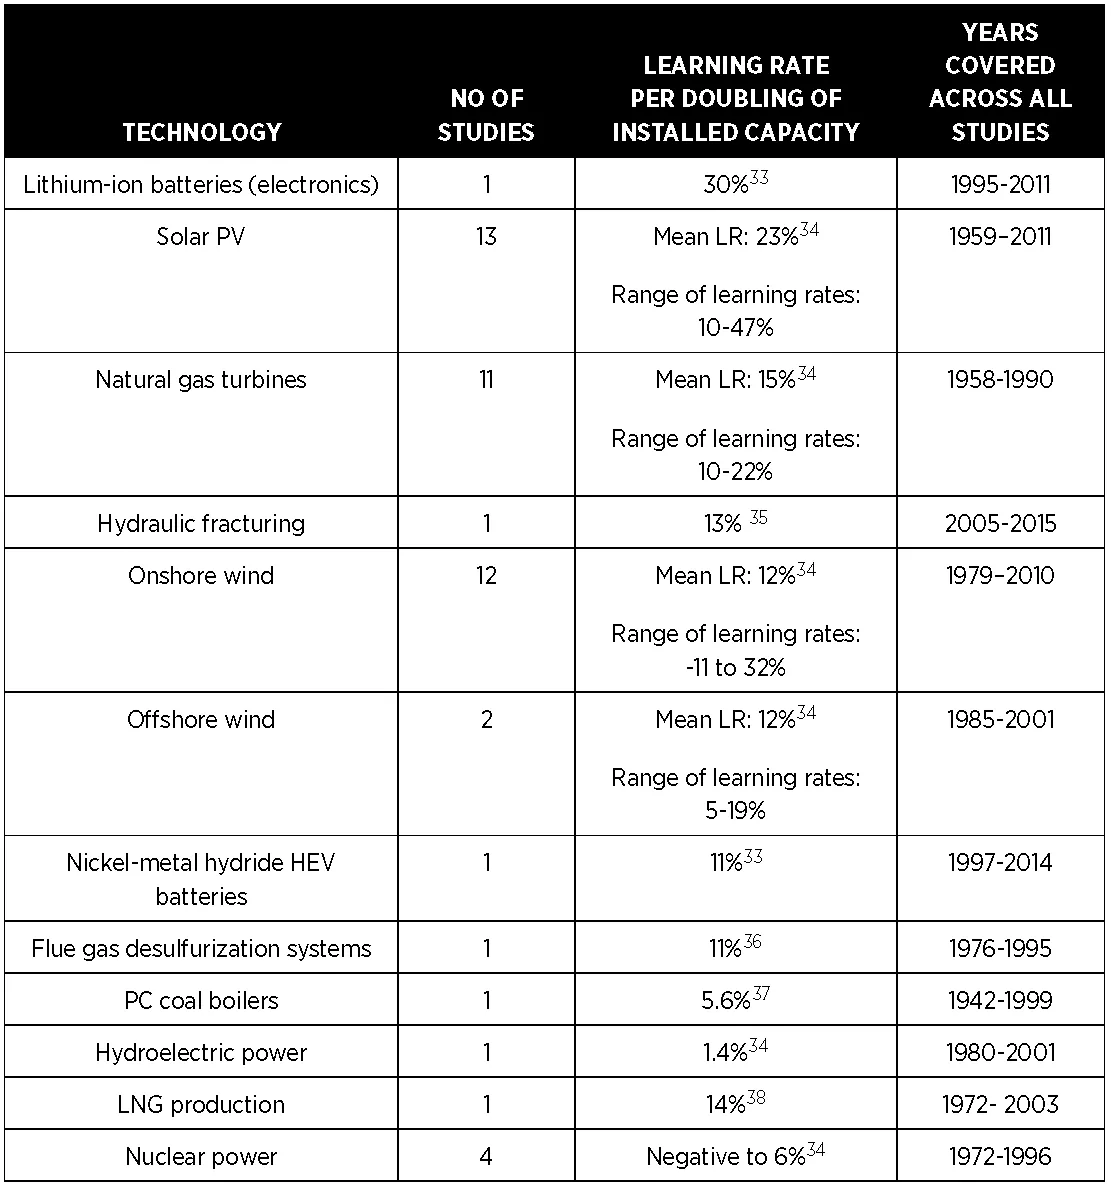
Learning rates for a variety of energy and related technologies are summarised in Table 1. Observed values of learning rates (LR) for energy technologies are usually in the range of 0% (negligible learning) to 30% (very fast learning). Large, sitebuilt technologies that are not standardized tend to show low LRs (and negative LRs in the case of nuclear power). Higher LRs are commonly associated with modular, manufactured technologies, such as solar PV and lithium-ion batteries.
Among the technologies reviewed, the characteristics of DACCS appear most similar to gas turbines, LNG, Flue Gas Desulphurisation, and onshore wind. For example, these technologies all require an element of site-specific design. However, there is potential for standardisation. For example, direct air capture units may be standardised, by analogy to wind turbines. In contrast, DACCS has the additional challenge of integrating capture with transport and storage of CO2.
Analogies with these other technologies imply a potential range of learning rates for DACCS of 10-15%. We have modelled rates of 10% and 12%, with 15% as a sensitivity. Comparison with the range of other industries makes 15%, the learning rate for gas turbines, appear optimistic for DACCS.
Climeworks has made a separate assessment of learning rates and estimated a learning rate of 10-12%.32 BCG suggests learning rates of 11-13%, with an upper case of 15% also examined, apparently based on an assumption of effective knowledge sharing across the industry. Our assessments are thus in line with those of other modellers.
3.3. Assessing Early Deployment
The initial costs estimated in Section 2 are assumed to apply to a first generation of large-scale plants coming online in the next five to seven years (by 2028-2030). This assumption is important because the number of subsequent doublings of capacity is based on this starting point.
We have assessed current plans for project development, including the support for the two projects each of about 1 Mt p.a. announced by the U.S. Department of Energy.39 In making this assessment we take account of the need to manage the technical and financial risks associated with scale-up, where financial exposures are orders of magnitude larger than for current demonstration scale plants.
Based on these considerations, we assume a range of total capacity for these first-generation plants of 1-4 Mt p.a. of net removals by 2030.
The high deployment case represents rapid early growth relative to the current base, with capacity equivalent to the two announced Department of Energy funded projects being completed, and about as much again online by 2030. This rapid early deployment appears essential if DACCS is to reach Gigatonne scale by the mid-late 2050s. The medium deployment scenario includes 2.2 Mt p.a., equivalent to the two Department of Energy funded projects proceeding, plus smaller demonstration projects, or variants such as one of the projects receiving funding only reaching 0.5 Mt p.a. capacity, but with another going forward. The low deployment case assumes slower progress, with only 1 Mt p.a. online by 2030.
3.4. Assessing Rates of Deployment After 2030
To assess potential future deployment, we draw on the literature on historic rates of growth of energy technologies. In doing so, we note that estimates reported in the literature are often not directly comparable. For example, they may cover different periods, and different stages of market penetration.
3.4.1. Growth Rate of CCS
CCS offers the closest technology analogy for DACCS, although the analogy is not exact. Both CCS and DACCS require capture, transport, and storage of CO2. However, the capture unit differs and energy requirements are greater for DACCS. Some CCS deployment has been driven by a commercial imperative for use in natural gas processing, which is not present for DACCS. Most CCS to date has benefited commercially from the use of CO2 for EOR.
The Sleipner project, the first large-scale CCS project to inject CO2 into saline aquifer, began in the late 1990s. It has taken about two and a half decades for CCS to get from this project to 2022 levels of about 44 Mt p.a.40,41 (Figure 3). Although there were EOR projects before Sleipner (from 1972, which are included on Figure 3), these were not built with the intention of storing CO2 permanently.
Recent rates of deployment have been faster in absolute terms, with approximately an average of 2.5 Mt p.a. of capacity added between 2009 and 2019. Figure 3 assumes that all projects can operate at full capacity, which has not been the case for some projects to date, notably the Gorgon project in Australia.
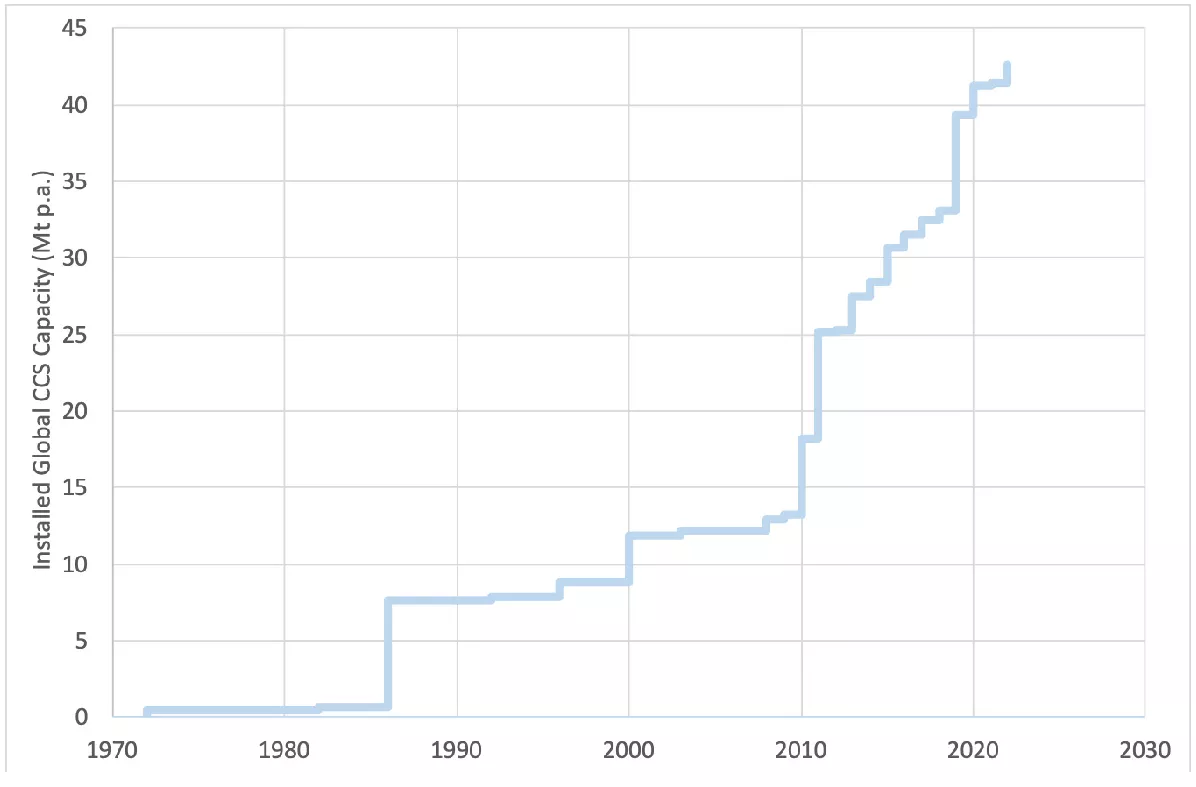
There are indications that the rate of deployment of CCS is likely to increase substantially in future. Governments and project developers in a range of locations in North America, Europe and the Middle East are looking at hubs storing CO2 from multiple projects. There are now over 200 projects in various stages of planning and development worldwide with a potential total capacity about 250 Mt p.a., six times the currently installed base.43 However it is too early to say how many of these projects, or any additional projects that may yet be developed, will be completed.
3.4.2. Growth Rates for Other Energy Technologies
Other energy related technologies work has shown slower or similar rates of growth to CCS. A survey of the literature (Iyer et. al. 2015 )44 found that natural gas and coal power had grown globally at 5% and 7% respectively. Flue gas desulphurisation capacity in the United States grew at 15% p.a., reflecting strong legislative drivers and supportive policy, including emissions trading.
3.4.3. Maximum Growth Rates for Energy Technologies
There is also the possibility of more rapid growth. Work carried out in the late 2000s45 examined growth rates for a range of energy technologies (including nuclear, LNG, biofuels, solar, wind, and CCS). It looked at their early stages after achieving commercial scale (that is excluding growth from demonstration to commercial scale). This work found that in their early decades total installed capacity grew by a maximum of a factor of 10 per decade (26% p.a.). Only solar significantly exceeded this rate. Once technologies exceeded 1% of world energy demand it became more difficult to sustain such growth at the same percentage rate. This is broadly consistent with the standard approach to modelling market growth using a logistic function (s-curve). Such functions show an initial period of exponential type growth, followed by more linear growth.
T he work projected such growth rates as being possible for wind and solar, with CCS potentially faster. Observed deployment rates have turned out to be largely in line with the projections for solar and wind, with CCS growing much more slowly than projected.
The data included technologies for which there has been strong political support. For example, the oil price shocks of the 1970s helped stimulate demand for nuclear electricity on security of supply grounds. The data also included technologies where large economies of scale have been achieved and some standardisation has been possible, notably wind power.
More recent work by other researchers46 has confirmed more than ten times growth in installed capacity per decade for solar PV, with wind a little slower. It found similar rates of growth for hydrogen and ammonia produced by electrolysis, although these technologies have not yet been deployed at large scale, and for batteries.
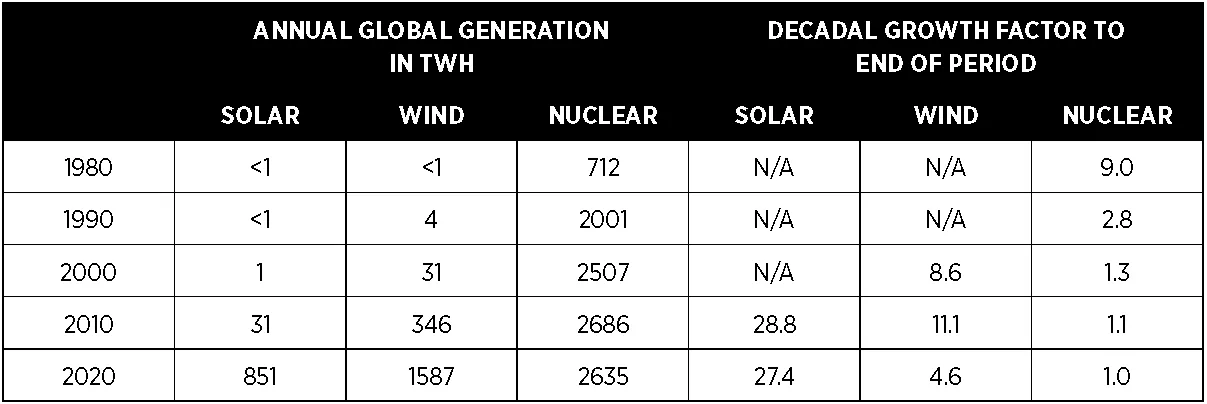
Table 2 shows these patterns of growth for selected technologies. Nuclear grew by almost an order of magnitude from 79 to 712 TWh, in the 1970s. Output then gradually plateaued. Wind power grew by around an order of magnitude in the 1990s and again in the 2000s. The installed base then grew by a factor of 4.6 in the 2010s, reflecting the larger scale already achieved, with the rate of annual installation continuing to grow significantly in absolute terms. Solar PV has continued to grow very rapidly. This appears to have been helped by rapidly falling costs reflecting a high learning rate, and the readily scalable nature of the technology.
The characteristics of DACCS resemble technologies such as LNG or wind power more closely than they resemble solar PV. These characteristics do not appear consistent with sustained growth to large scale being achieved more rapidly than observed for most other energy-related technologies. For these reasons a maximum rate appears likely to be around an order of magnitude per decade, with growth becoming more linear once it has reached a scale of hundreds of millions tonnes p.a.
However, the characteristics of DACCS make it likely that this will nevertheless be challenging to achieve.
- DACCS projects are complex, with multiple elements (including energy supply, the capture units, and CO2 transport and storage).
- Finance for each project will need to be large-scale (into the billions of dollars investment per project for plants with capacity of a million tonnes p.a. or more).
- There will be significant lead times for planning, permitting, and construction in many cases.
- Other resource requirements are large. One Gt p.a. of removals would require around 1,400-4,200 TWh p.a. of additional low-carbon energy. This compares with total global generation in 2022 of just under 1,300 TWh of solar PV and just over 2,100 TWh of wind.47 Total U.S. utility-scale electricity generation in 2022 was about 4,240 TWh.48 A Gt of DACCS will also require more than 20 times the current global installed base of CO2 transport and storage for CCS.49
- There remain many emissions reductions that will cost much less than DACCS per tonne CO2 and governments may prioritise these for the use of scarce funds. They may also prefer removals to biogenic sinks on grounds of availability and cost, even though these are at greater risk of reversal.
- Momentum will need to be sustained over multiple decades, which to date only appears to have been achieved by renewables.
Others have suggested even more ambitious deployment scenarios. However, we do not find substantive evidence that such high rates of growth are likely to be achievable in practice.
3.4.4. Scenario Assumptions for Deployment
Based on this analysis we have developed scenarios for growth of DACCS deployment. They are, of course, indicative, and may vary somewhat in their timing in either direction.
We specify a starting point for capacity by 2030, as set out above. We then model growth rates based on an approximation of a logistic function (s-curve). Growth is assumed to be exponential, with a constant percentage growth rate, until DACCS reaches larger scale. After this growth becomes more linear in the high and medium deployment cases.
T he low deployment scenario shows DACCS remaining a niche technology on a global scale to 2060. Total capacity in 2060 is assumed to reach about 50% greater than that of current CCS projects globally. Slower growth rates than this are credible if there is limited policy support for DACCS.
In this scenario, levels of deployment will not make a material contribution to meeting 2050 targets. They may nevertheless have value, enabling learning about DACCS while giving time for infrastructure to be further developed, including decarbonised energy supply and CO2 storage capacity. This may help position DACCS to make a significant contribution to net negative emissions later this century.
Under the medium deployment scenario, deployment results in 80 Mt p.a. capacity by 2050. This is approximately double the current installed base of CCS. Growth is assumed to become more linear thereafter. This is still too small to make a major difference to net global emissions in 2050, but establishes DACCS to potentially become a larger contributor to climate goals thereafter, reaching over 300 Mt p.a. by 2060.
Only the high deployment scenario shows removals sufficient to make a material difference to meeting climate goals by 2050. Capacity grows by a factor of 10 per decade and reaches 400 Mt p.a. by 2050. It continues to grow thereafter, reaching Gigatonne scale before 2060. Achieving the high growth scenario is likely to require very strong policy support in multiple jurisdictions over several decades.

3.5. Costs Over Time
To explore the potential for cost reduction over time we have developed three cost scenarios based on the three deployment scenarios described above:
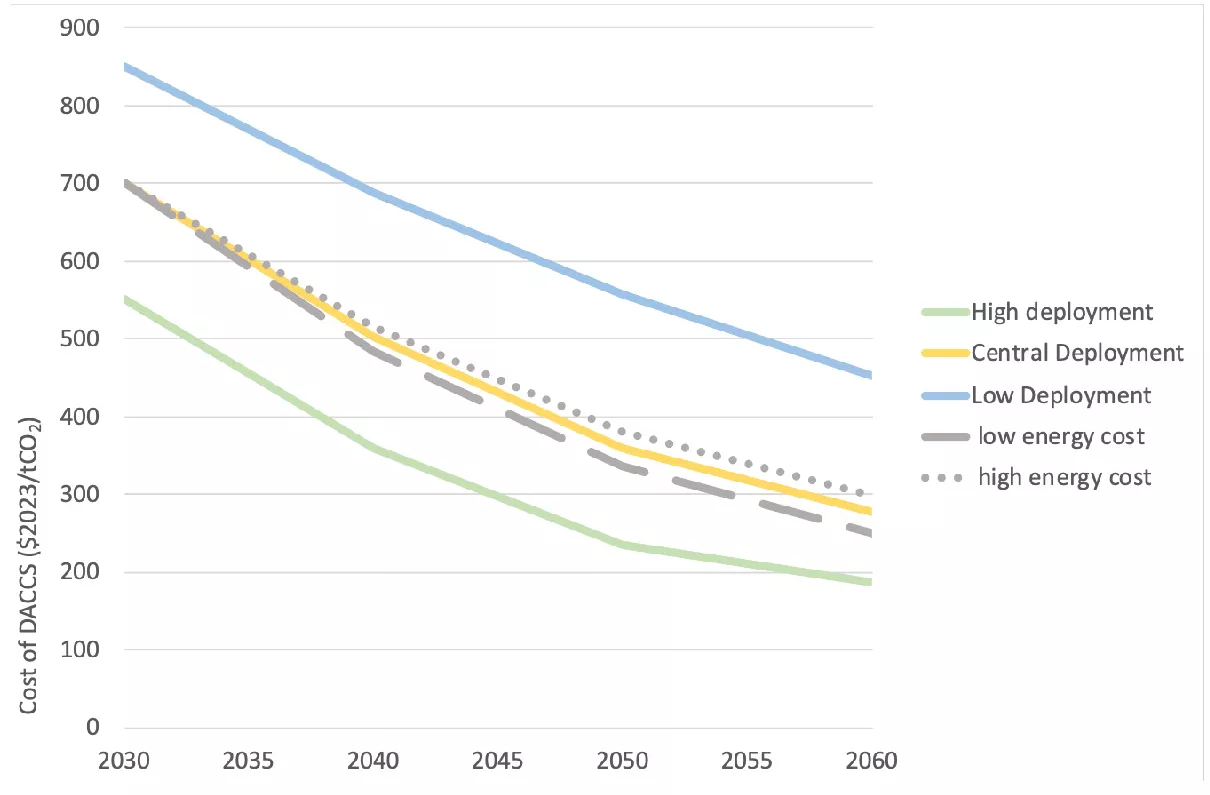
- High deployment, which is combined with a learning rate of 12% and a cost of $550/tCO2 in 2030.
- Medium deployment, which is combined with a learning rate of 12% and a cost of $700/tCO2 in 2030.
- Low deployment, which is combined with a learning rate of 10% and a cost of $850/tCO2 in 2030.
Sensitivities show the medium deployment scenario with energy costs treated separately in a two-factor model. We have not modelled cost trends stochastically as the data is too sparse to allow reliable probability distributions to be specified.
Figure 4 below shows how costs may evolve in the three scenarios, and the sensitivities. Costs are total cost across the value chain, including transport and storage, and energy supply. There will continue to be wide variations in costs between projects due to location and other factors. Costs here should be regarded as indicative costs for good projects.
The results show only small cost falls in the low deployment case. This is consistent with DACCS remaining an early-stage technology over the next two to three decades.
Costs are much lower in the moderate deployment case, but are still about $360/ tCO2 by 2050, and reaching $280/tCO2 by 2060. Differences in total costs when energy costs are modelled separately are small compared with the range of possible outcomes.
Cost levels reached depend on costs for early plants. If early plants have a cost $800/tCO2 then costs remain at or above $400/t in 2050 and above $300/t in 2060.
In the high deployment case, costs reduce to about $240/tCO2 by 2050, falling more slowly thereafter. This would be lower if high deployment is combined with costs of early plant of $400/tCO2 (not shown on Figure 4) reaching below $200/tCO2 by 2050.
We expect further cost reductions to be progressively more difficult due to physical limits being reached, imposed by the need to handle large volumes or air, and to extract CO2 at low concentrations. However, the level of such limits and any accompanying cost floor is currently unknown.
Climeworks project more rapid cost reductions, at 50% per decade, though estimates are in broadly similar ranges. Climeworks estimates that around 2030 cost will be below $1000/tCO2; around 2040 costs will be well below $500/tCO2; towards 2050 a cost level between 200 and $250/tCO2 should be within reach (all at today’s currency value).50 Deployment appears similar to our high case as they note expecting an average of a tenfold in installed capacity per decade as the upper limit.
3.6. Prospects for Achieving Target Costs
Various targets have been set for the cost of DACCS. For example, the U.S. Department of Energy has set a target cost of $100/tCO2. A target cost can be achieved with various combinations of:
- costs for early full-scale plants, which we have here taken to be the first 4 Mt p.a., assumed to be online by 2030;
- amount of subsequent deployment, which is based on scenarios;
- learning rates, where we have examined 10-12%, with 15% as a sensitivity only, given it seems unlikely to be sustained over multiple orders of magnitude (see above).
Here we examine the combinations of these variables that would be required to achieve target cost of $300/tCO2, $200/tCO2, and $100/tCO2.
3.6.1. Prospects for Achieving $300/tCO2
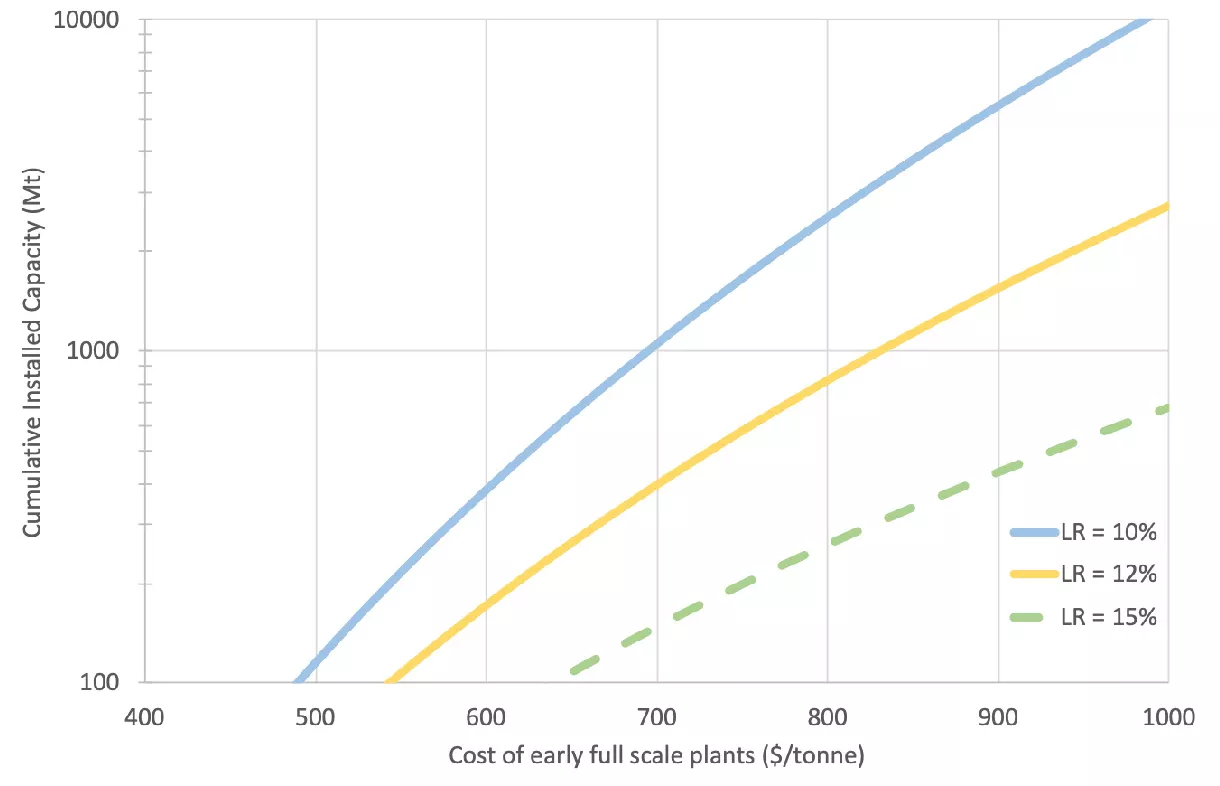
Figure 5a shows the different combinations of these three factors that could lead to costs reaching $300/tCO2. The horizontal axis shows costs for early full-scale projects in 2030. The lines on Figure 5a then represent different learning rates. The 15% learning rate is shown as a dashed line, because it is a sensitivity only. The vertical axis indicates the amount of capacity that would need to be built given a specified learning rate and starting costs in 2030. As an example, with costs for early full-scale projects of $700/tCO2 and a learning rate of 12%, deployment of 400 million tonnes p.a. of DACCS will be needed to reach the target cost of $300/tCO2 (note the logarithmic scale). With a learning rate of 10%, around 1 Gtp.a. of deployment is needed to reach 300/tCO2.
T he $300/tCO2 target can be reached by deployment of between about 100 million tonnes or less and 1Gt p.a., unless costs of early plant are in the upper part of the expected range or learning rates are 10%, in which case greater deployment will be needed to reach $300/tonne.
3.6.2. Prospects for Achieving $200/tCO2
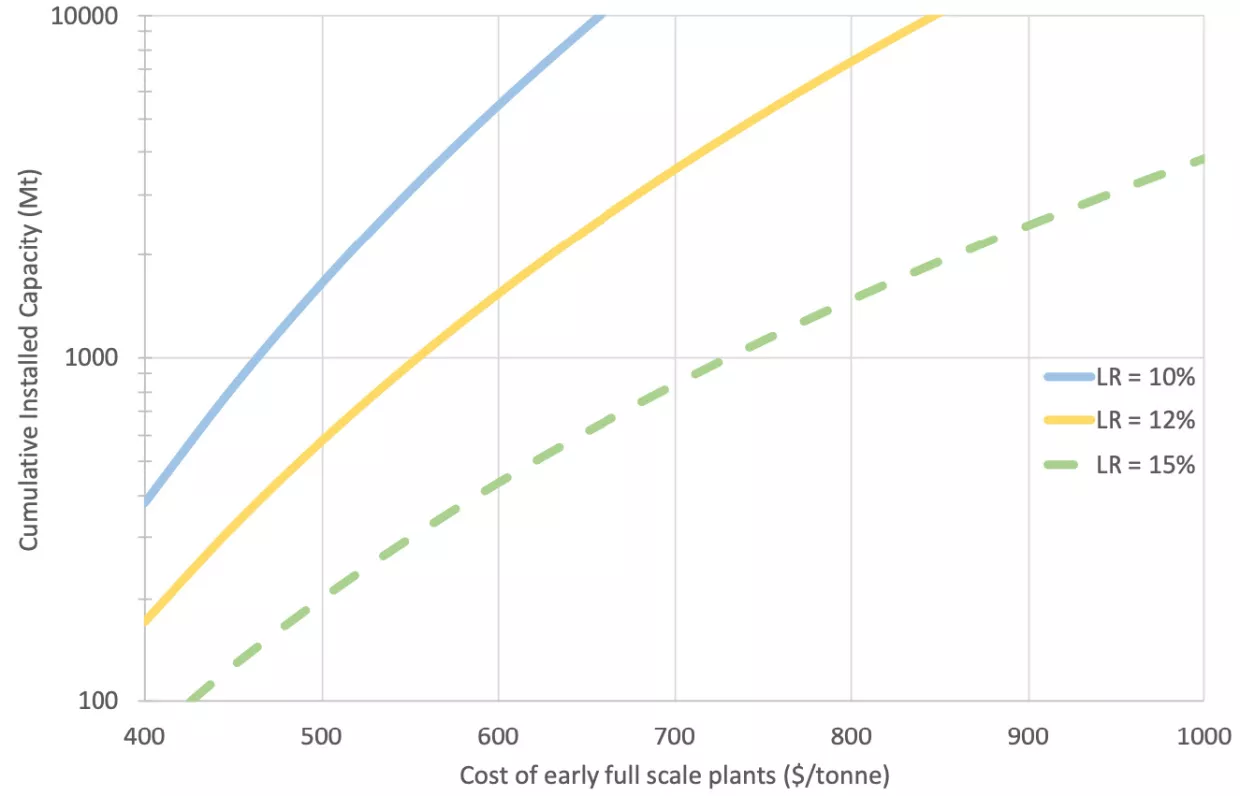
Figure 5b below shows similar analysis for a target cost of $200/tCO2.
To meet this lower target, costs of early plants coming online in 2030 would need to be towards the lower end of the expected range, at around $400-550/tonne, and large-scale deployment would be needed, unless learning rates could be sustained at 16%, which appears unlikely. If costs for early full-scale plants are above about $550/tCO2, a target of $200/tonne looks difficult to achieve even by 2060.
3.6.3. Prospects for Achieving $100/tCO2
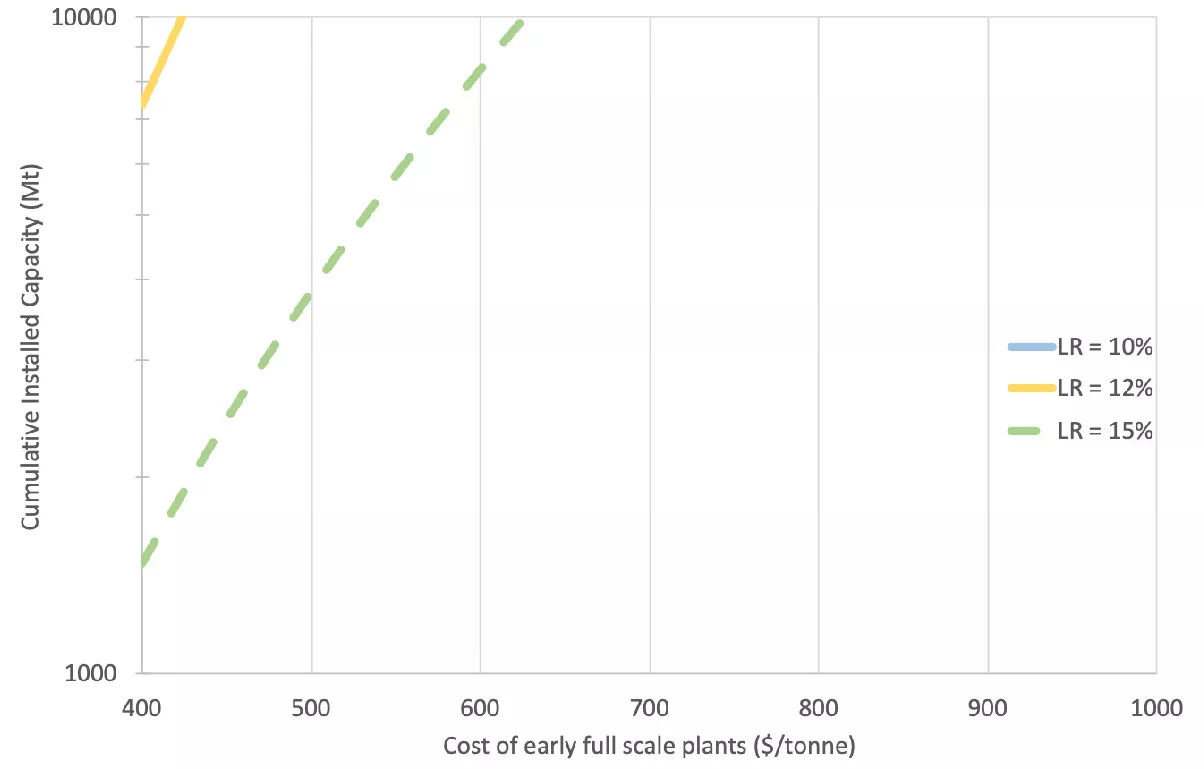
Figure 5c shows similar analysis for a target cost of $100/tCO2. The total of 10 Gt p.a. shown on the vertical axis seems likely to be close to or beyond any practical upper limit on cumulative installed capacity. It is similar to the annual rate of removal required under 1.5 degree overshoot scenarios (see Introduction). It would take many decades to get to this scale, and maintaining sufficient political support would likely be extremely difficult. Resource requirements for reaching this scale would be huge.
Even in the unlikely case of up to installed capacity approaching 10Gtp.a., $100/tCO2 can practically not be reached at all with low or moderate learning rates. With fast learning rates, which seem unlikely to be sustained over such a large capacity addition, the target is only achieved with costs of early full scale towards the lower end. A $100/tonne target therefore seems unlikely to be achieved over any policy-relevant time horizon.
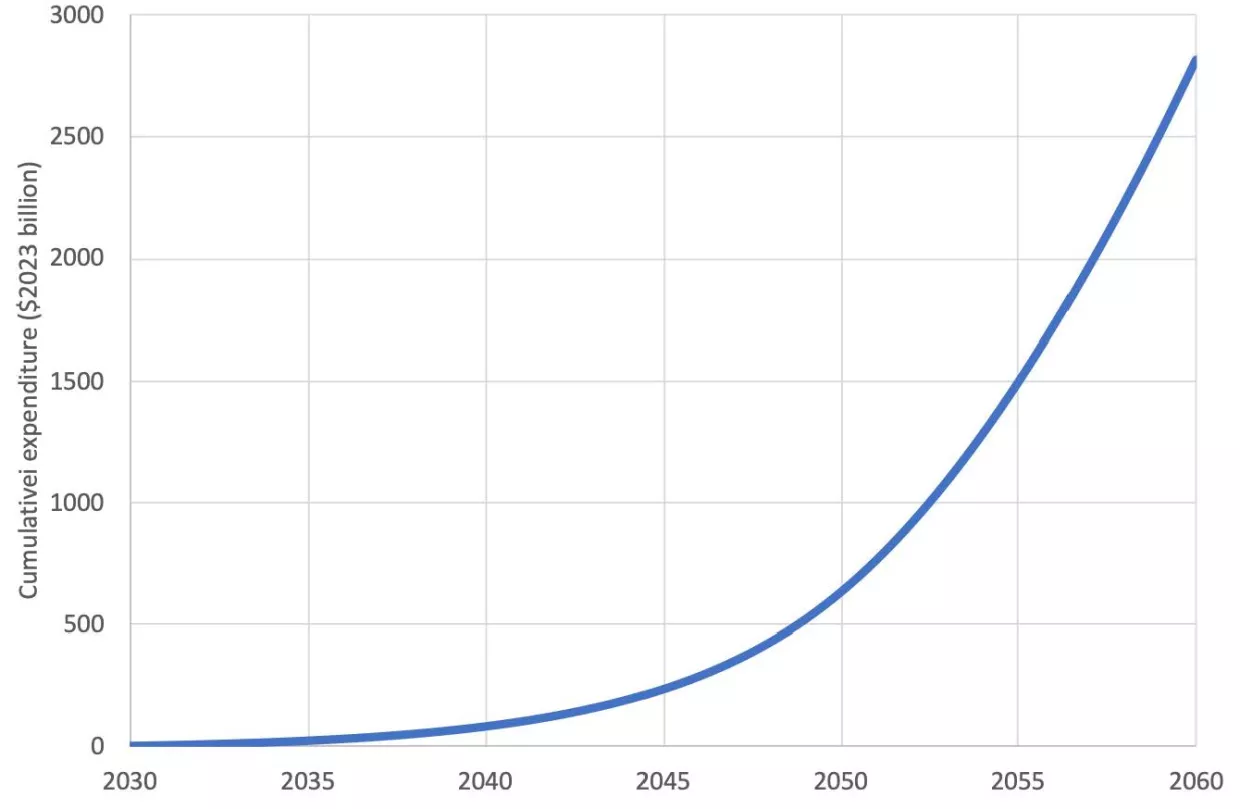
3.7. Total Cumulative Costs
The costs of getting DACCS to Gigatonne scale are large. Capital costs of more than $1 billion for a 1 Mt p.a. plant imply amounts of capital into the trillions dollars are needed to reach Gigatonne scale.
We have also looked at levelized costs (Figure 6). The annual levelized total cost of each plant over 20 years is calculated. This is summed for all plants online at a given date to give total levelized costs for each year. Earlier plants have higher costs than later plants, in line with the cost modelling presented above.
The annual costs are added over time to give cumulative costs, which reach around $1-3 trillion in the 2050s in the high deployment scenario. This assumes costs of $550/tCO2 for early plants. If this cost were higher, cumulative costs would be proportionately higher, assuming the same rate of deployment.
The calculation is of costs only. No benefits are included.
3.8. Engineering Assessments of Cost Reduction Potential
We have assessed the potential for cost reductions based on engineering fundamentals. This is intended to provide a “reality check” on the cost trends modelling presented above. We have not carried out any engineering modelling for this work.
The potential for cost reduction is influenced by various factors, which sometimes work in opposite directions. The potential to reduce costs appears to be large, due to the early stages of the technology’s development. In contrast, there are physical fundamentals that make large cost reduction more difficult. In particular, the low concentration of CO2 in the atmosphere inevitably requires large volumes of air to be moved and treated (see Introduction), with correspondingly large requirements for energy and materials.
We nevertheless find many areas in which substantial cost reductions appear possible. The mix of costs, and the potential for different types of reduction, are likely to vary greatly with location and technology. The main costs of the capture unit, with indicative shares of costs for the capture plant,51 are:
- the capital cost of the capture plant, including construction costs and land acquisition (63%);
- energy costs (24%);
- other operating costs, of which the cost of sorbents is the largest component (13%); and
- CO2 transport and storage costs, which may also be large, depending on location.
Correspondingly, we find potential for cost reduction in each of these areas.
Lower construction costs. There may be substantial opportunities, for example in standardizing unit design.
Reduced cost of capital. As technologies mature and risks correspondingly decline, required rates of return will decrease. This could, illustratively, lower project costs by approximately 9%.52 Opportunities for lower cost of capital may depend on the type of policy support available (see next section).
Improved reliability reducing unit capital costs. As the technology matures it is likely to become more reliable. This should enable increased load factors and thus lower unit costs.
Reductions in costs of low-carbon energy. In practice, energy supply for DACCS is likely to be mainly solar and wind, where costs are expected to continue to fall as more widespread deployment continues. While some projects may rely on fossil fuels with CCS for their energy supply, this is likely to be too costly in most locations. Nuclear may also be too costly, though it may provide good opportunities for matching supply with baseload demand (see below), and there may be the potential for greater efficiency from the use of waste heat from the nuclear plant.
This does not imply that costs of low-carbon energy will necessarily be lower than costs of high-carbon energy, especially when costs of managing variable production of renewables are taken into account. However, the use of high-carbon energy sources greatly reduces the amount of net removals. Consequently, net costs per tonne of removals will usually be lower if low-carbon energy is used, even if the high-carbon energy is cheaper.
In the short to medium term there may be opportunities to use waste heat from industrial plants, although such opportunities may decline as industrial processes decarbonize.
Longer lifetime and improved performance of sorbents. There also appear to be opportunities to reduce capital costs by increasing the recovery ability of the sorbent, which reduces the required size of the capture unit. This may increase costs of the sorbent in the short term but the capex reduction is likely to be the more significant over time. In the case of liquid sorbents, development in processes should keep disposal costs low, and reduce fugitive emissions when they are in service. These materials should also require less energy to regenerate.
Lower costs of other utilities such as water may be important in some cases.
Access to low-cost CO2 transportation and geological storage. Cost reductions may come from siting DAC facilities close to storage locations, where both transport and storage costs are low. Lower costs may be achieved by economies of scale from existing CCS. While the overall technical capacity for storing CO2 underground worldwide is estimated to be vast, detailed site characterization and assessment are still needed in many regions. An operating CO2 storage site can take three to ten years to develop from project conception to CO2 injection. This could become a bottleneck for DACCS deployment (and wider CCS deployment) without accelerated efforts to identify and develop CO2 storage sites.
Improved efficiency by optimizing for local conditions. There may be opportunities for increasing average efficiency of the capture unit by managing directly the humidity and temperature of the incoming air. Cool air is preferable, as adsorption or absorption in general increases with decreasing temperature. Dry air will tend to be better for solid adsorbent systems. Less water is present to compete with CO2 for removal, which means less solid material is required, and hence smaller equipment can be used, reducing the capital and operating costs. In the case of a humid climate, it may be advantageous to either have a dehumidification system, or to make the solid material hydrophobic (so not adsorbing water) to help lessen the effects of humidity. This may not be an issue for liquid systems.
Improvements in overall process integration can reduce a range of costs, including both capital and energy costs. An area of particular importance may be in the integration of power supply and the capture plant (see below). Low-cost energy can also enable changes to design which substitute energy for capital, which may also reduce total costs.
Scale can also bring a range of costs down. Larger-scale plants should have lower unit costs, and development of multiple projects should lead to cost reductions, including through increased availability of standardized products as the industry grows.
3.8.1. Reductions in Energy Costs
There are potential gains in more effectively managing the differences in patterns between energy supply (variable) and patterns of energy use (largely constant). This could include increasing storage, especially as the costs of diurnal storage reduce. It could also include active management of the load across the day, and across longer timescales. It could also include better integration with the wider electricity grid. Seasonal variations may be more challenging to manage.
In any case, it will not be appropriate to treat energy costs as a simple $/kWh based on the prevailing Levelized Cost of Electricity from a solar PV array. It is often not clear how existing cost modelling in the literature addresses this issue.
4. Policy Support to Finance DACCS
DACCS will require substantial policy support. Required support includes establishing adequate regulatory frameworks for DACCS. In particular, monitoring, reporting, and verification (MRV) processes will be required, for example to measure the amount of CO2 stored. Regulatory frameworks will need to extend to reliable certification of removals.
Policy support will also be needed to meet the substantial costs of DACCS, which are not currently funded by commercial markets. Voluntary markets for carbon removal may play some role. However, they are unlikely to be anywhere near enough to achieve full commercialisation of DACCS. The high unit costs of DACCS and the large absolute sums required imply that use of compliance markets and other regulatory approaches will be necessary. This may include inclusion of removals in emissions trading systems.
Financial support for DACCS projects could be provided by a range of regulatory mechanisms, which may be used in combination. The choice will depend on the circumstances of the project and the jurisdiction.
Funding need not necessarily come ultimately from governments. It may, at least in part, come from hard to abate sectors, for example long haul aviation. These sectors may eventually require permanent net removals to balance their emissions. They could be obliged by regulation to purchase the necessary removals. This would be consistent with the Polluter Pays Principle. However, overall “netnegative” emissions, with removals of past emissions to reduce atmospheric concentrations, will likely require funding from governments.
Policy support will need to be sustained over decades, because this is the amount of time needed for scale-up. This is likely to be especially challenging as DACCS does not produce a product that has value beyond its benefits for the global climate. Products made from CO2 that keep the CO2 permanently out of the atmosphere are likely to provide only small markets globally compared with volumes captured. In contrast, products of other low-carbon technologies have wider value. For example, electricity from low-carbon power generation earns income from electricity sales, and has benefits for energy independence. Similarly, energy efficiency measures can reduce costs.
In this section we briefly review how policy may enable financing of the substantial costs identified in the previous two sections. Appropriate choices of policy instruments can help reduce costs and accelerate deployment. There are few examples of financial support for DACCS to date, although some are beginning to emerge. However, insights can be gained from considering policy support for CCS and other low carbon technologies.
4.1. Designing Policy Support
DACCS is capital-intensive, implying that support will be particularly valuable if it reduces:
- total capital costs; or
- required rates of return (cost of capital), and thus levelized costs of removals.
4.1.1. Capital Grants and Other Capital Subsidies
Total capital costs to project developers may be reduced by capital grants. These may be provided in cash, or in other ways, such as access to land for projects at preferential rates. In the United States, Canada, and elsewhere, capital support may be in the form of investment tax credits. Low-cost loans can provide similar benefits by reducing the weighted average cost of capital, and thus total costs.
A potential weakness of these forms of support is that they give little or no incentive on their own for the operation of the capture project. Consequently, capital subsidies may often be used in combination with other forms of support. This may include operating costs subsidies.
The role of subsidies for CCS is illustrated by Norway’s Longship project, which is currently under construction. The Norwegian State will pay around three quarters of the costs of the project. This support will run for the first 10 years. The State also takes a large proportion of the risk of cost overrun up to specified limits. In broad terms, for capital costs it takes 80% of overrun costs for Northern Lights, which is the transport and storage part of the project, and 83% for the capture plant. For operating costs over the first 10 years, it takes 75% of the costs of overruns for transport and storage and also 75% for the capture plant.
Investment and production and tax credits can also provide substantial subsidies. In the United States, the Inflation Reduction Act has expanded and enhanced the existing 45Q tax credits to $85/tCO2 for CCS, with new provision for DAC, including a higher incentive level at $180/tCO2 for storage in saline formation. For DAC facilities, it decreases the CO2 capture requirements from 100,000 tonnes captured per year to 1,000 tonnes per year, implying smaller demonstration projects can benefit.53
In addition, the Investment and Jobs Act (signed into law in November 2021) includes funding of $3.5 billion to establish four large-scale DAC hubs and related transport and storage infrastructure. This is the largest commitment any jurisdiction has made to DAC so far.
Recently the Department of Energy has announced funding for two large scale DACCS projects, which appears to be in the form of direct subsidy.
Projects can also benefit in some cases from tradable credits under the California Low Carbon Fuel Standard, providing the DAC project meets the requirements of the Carbon Capture and Sequestration Protocol. These may be combined with tax credits and other forms of support to make a package that will enable projects to proceed.
4.1.2. Payments Under Contracts
Contracts that provide a payment per net tonne of CO2 removed from the atmosphere and permanently stored are likely to be an effective way of incentivising construction and operation of DACCS plant. Basing payments on net tonnes removed from the atmosphere aligns financial rewards to the project with the project’s climate benefits.
Contracts between the project and an appropriate counterparty, such as a government backed company or agency, can reduce project risks and thus cost of capital. This reduction in risks is likely to be especially marked if the payments are made under a private law contract, rather than as discretionary government payments, because it reduces the risk of unexpected reductions in payments due to changes in policy.
For example, in the UK, a company owned by government (the Low Carbon Contracts Company, LCCC), is the counterparty for contracts (CfDs) with renewable energy projects, and makes and receives payments under the contracts. Electricity suppliers are required by regulation to fund the CfD payments made by LCCC to generators through the CfD Supplier Obligation Levy. Studies have indicated that this approach to funding has created significant benefits when used to support offshore wind power.54
DACCS is capital-intensive, so reductions in the cost of capital can have a significant effect on total costs. Illustratively, each one percentage point reduction in cost of capital due to the type of support available can reduce total cost per tonne of removals by approximately 5%.55
The UK is in the process of negotiating contracts to support industrial carbon capture. Contracts will include separate capital cost and operating cost payments. The capital remuneration component is planned to run for five years, consistent with the short paybacks required by industry. The opex remuneration component runs 10-15 years. For early projects, payments will not vary with the actual market price for carbon, which is set by under the UK Emissions Trading System (UK ETS). However, it is intended that this will change for subsequent rounds of projects, with payments varying with the carbon price under a contract for difference (see below).
4.1.3. Contracts for Difference
Contracts for difference (CfDs) may be appropriate if a market price of removals develops. Under a CfD, a payment is typically made for the difference between a market price, for example for electricity or carbon, and a pre-determined price, the strike price. This essentially fixes the price the project receives. If a project can earn revenue from the sale of carbon dioxide removal certificates, then subsidy payments can be reduced accordingly under the CfD, and the project can remain profitable.
For example, if certified removals from DACCS projects can be sold in an emissions trading system, they will earn revenue that depends on the prevailing carbon price. The higher the price, the lower the required subsidy. In such circumstances, support may then be set under a CfD on the carbon price (Carbon CfD, or CCfD), with subsidy decreasing as the carbon price rises. Such mechanisms are also currently under discussion elsewhere, for example for the EU’s Innovation Fund.
4.1.4. The Importance of Competition for Funding
The level of contract payments can likely be reduced by the use of competition to award contract-based funding. Competition for contractual support has been important in driving down prices paid for renewable energy and other low carbon technologies. Competition is likely to be in the form of an auction for contracts, or some form of competitive tender.
Separate allocations may apply to different technologies, with different amounts of support. This has been common in renewables, for example with different allocations for onshore wind and solar. This helps ensure that a variety of technologies with different characteristics are supported.
The Dutch SDE++ mechanism provides an example of such support for CCS. Under this system support is awarded to CCS as a contractual payment per tonne of CO2 stored. Contracts are awarded by auction, with support awarded to the lowest cost per tonne. There are parallel auctions for different types of project, for example renewable electricity and CCS.
4.1.5. A Regulated Asset Base (RAB)
Under a Regulated Asset Base approach, costs are recovered by charges to customers for the service provided. Typically, a regulator awards a company a licence to charge a regulated price to consumers in exchange for the company providing essential infrastructure. This enables investors to share some of the project’s construction and operating risks with consumers, helping to lower the cost of capital.
Such approaches are used for various types of infrastructure, including natural gas and electricity networks.
Under such an approach is may be more difficult to maintain competition between projects, so risking higher costs. It is also more difficult for the regulator to assess costs for an industry with rapid innovation, such as DACCS, than for more wellestablished industries, such as natural gas networks.
We do not expect a RAB model to be used for DACCS value chains as a whole, except perhaps in the long term. However, it may play a role in providing transport and storage networks.
4.2. Creating a Market for Removals
In the medium and longer term, removals could become a traded commodity, with projects earning revenue from removals markets. This may happen through an ETS modified to include removals, with any emissions requiring surrender of either an emissions allowance or a certified tonne of net removals. Alternatively, jurisdictions may adopt arrangements where there are obligations on remaining emitters to balance any emissions with removals, but without creating a full ETS.
Eventually, caps under emissions trading systems will need to be set to zero, consistent with net zero commitments. This will require the total volume of remaining emissions to be matched by removals. The price and volume of removals should, in principle, then be driven by demand from hard to abate sectors, with removals preferred where they are cheaper than abatement.
Variants of such approaches are possible. For example, an exchange rate might be introduced where more than one tonne of removals is required to balance a tonne of emissions, in order to recognise uncertainties and risks. Also, governments may act as intermediaries, rather than emitters and owners of removal certificates trading directly.
The UK government has recently concluded that the UK Emissions Trading System (UK ETS) is an appropriate long-term market for greenhouse gas removals. It intends to include engineered GGRs in the UK ETS, subject to further consultation, a robust MRV regime being in place, and management of wider impacts.
Inclusion of removals in an ETS seems likely eventually to be favoured in the EU. Incorporation of removals in the EU Emissions Trading System is already being discussed. However, adoption of such measures in the EU appears likely only in the longer term, for example in the mid-to-late 2030s and beyond. This in part reflects concerns about the effects of early inclusion of removals, in particular that they may weaken incentives for emissions reductions (mitigation deterrence).
Where no ETS is in place, demand for removals may be created by other forms of regulation. For example, governments may require emitters or emitting sectors to buy a specified quantity of certified removals.
In the longer term, there may be additional demand for removals from governments or other entities with obligations to achieve net-negative emissions. This could, for example, be in the form of tenders for defined quantities of removals.
4.3. The Potential Role of Revenue from EOR
T hecosts of DACCS can be mitigated if captured CO2 is used for Enhanced Oil Recovery (EOR) and the project benefits from the resulting revenue stream. This may reduce or eliminate the benefits of DACCS for the climate if it results in extra oil being burned. This could be reflected in reductions in the number of any certified removals credits earned. However, use of EOR revenues it may also reduce required policy support and thus aid in the early development of the technology.
One project developer, Occidental Petroleum (Oxy), is promoting the idea of “carbon neutral oil.” At present this appears to be mainly bundling offsets with oil. However, there are reported to be plans to develop DACCS to provide physical carbon neutrality, where the additional CO2 released from the combustion of additional oil recovered matches the net amount of CO2 captured by DACCS. This may include EOR associated with its capture plant currently under construction.
We estimate that approximately 1.6 additional barrels of oil production would create emissions equal to one tonne net of DACCS, allowing for emissions from the refining process. At an illustrative price of $80/bbl, this would produce $128 of revenue for each tonne of DACCS. If the oil were to obtain a premium price, for example because it helped meet corporate carbon neutrality goals, it could create greater value for projects. However, in doing so it may forego revenue from generating net removals, as these removals may not qualify for credits under a certification regime if oil from EOR is included in the certification lifecycle analysis.
5. Concluding Remarks
Based on the analysis presented in this paper we derive the following conclusions.
Potential scale
DACCS remains at an early stage of deployment and realising its full potential will take many decades.
By 2050, DACCS appears likely to achieve removals equivalent to at most about 1% of current emissions of fossil carbon from energy and industry, and likely significantly less than this. It will thus make at most only a small contribution to meeting 2050 net zero targets. Even by 2060 it will be challenging, and perhaps impractical, to get to net removals from DACCS as large as 1-3% of current global emissions. Among other things this illustrates the importance of focussing on emissions reduction wherever possible.
There appear to be few fundamental limits on the scale of total operating DACCS capacity, although it requires large-scale physical resources, especially energy. Consequently, DACCS may have a major potential role in the second half of the century, including in achieving net negative emissions.
To be effective, DACCS requires energy used to be low-carbon. This implies either dedicated low-carbon power, or a fully decarbonised electricity grid, and the means to produce low-carbon heat.
The earlier scale-up begins, the earlier benefits of DACCS will be realised. However, projections of the mix of removals employed over the coming decades inevitably remain highly speculative.
Costs
- We estimate that the costs of full-scale DACCS will likely be about $400-1000/tCO2 around the end of this decade, where tonnes are net tonnes permanently removed from the atmosphere. This total includes transport and storage costs.
- Costs will fall with deployment. Costs may fall to around $200-400/tCO2 sometime in the 2050s if large scale deployment is successful. However, the lower part of this range will only be achieved if costs of early plants are close to the bottom end of the currently estimated range of $400-1000/tCO2, there is rapid large-scale deployment of DACCS, and learning rates are moderate to high.
- Aspirational targets of $100/tCO2 seem unlikely to be reached even by 2060.
- Costs of $400/tCO2 may nevertheless be below the marginal cost of abatement in some sectors and applications. This could give DACCS a valuable role in meeting net zero goals at lower cost.
Funding
- Reaching Gigatonne scale of removals using DACCS will likely require cumulative expenditure into the trillions of dollars.
- The high costs of DACCS derive in large part from CO2 being very dilute in the atmosphere. It will usually be cheaper to capture emissions from more concentrated sources such as industrial plants, or to switch to low-carbon electricity or other low-carbon energy sources, preventing the CO2 getting into the atmosphere in the first place.
- Among other things the high cost of DACCS favours moving to high capture rates for industrial and power sector CCS projects, to reduce residual emissions which must then be removed. Industrial CCS projects can also help develop the CO2 transport and storage infrastructure necessary for DACCS, which can often have substantial lead times.
Financial and policy support
- There are now emerging instances of policy support for DACCS, including under the Investment and Jobs Act and the Inflation Reduction Act in the United States.
- Current high per tonne and total costs of DACCS, and lack of corresponding demand for removals, implies that strong financial and policy support will be required for initial deployment, including large subsidies for projects.
- Possible sources of funding include governments with a strong strategic interest in removals, including those wishing to sustain some level of oil and gas production, and those with strong negative emissions reductions commitments.
- Funding may also be made available from industries which may require permanent removals into the longer term, for example aviation. This would be in line with the Polluter Pays Principle.
- In most jurisdictions optimal policy support is likely to be a mixture of capital grants, tax credits, and contractual payments per tonne of net removal.
- The use of competitions or auctions to award funding has the potential to reduce costs in some instances.
Al-Juaied, Mohammed and Adam Whitmore. “Prospects for Direct Air Carbon Capture and Storage: Costs, Scale, and Funding.” Belfer Center for Science and International Affairs, Harvard Kennedy School, November 30, 2023
- CDR is also sometimes considered under the heading of Greenhouse Gas Removals (GGR), and also as Negative Emissions Technologies and Practices, NETP.
- https://ourworldindata.org/co2-emissions-from-aviation#:~:text=Flying%20is%20a%20highly%20
controversial,impacts%20on%20climate%20into%20account - Both conventional aviation fuels and Sustainable Aviation Fuels (SAFs) emit CO2 in use, putting carbon dioxide into the atmosphere. Equivalent volumes need to be removed from the atmosphere to achieve net zero emissions. This may be, either as part of manufacturing Sustainable Aviation Fuels (SAFs), or simultaneously with the emissions, for example using DACCS. Achieving climate neutrality also requires eliminating or balancing the non-CO2 effects of aviation, including those due to NOx production and contrails.
- https://www.ipcc.ch/site/assets/uploads/sites/2/2022/06/SPM_version_report_LR.pdf
- The EU has a target of a 55% reduction in total emissions by 2030. The EU 2030 target for net greenhouse gas (GHG) removals in the land, land use change and forestry sector is 310 million tonnes CO2 equivalent, of which 225 Mt CO2e is included in the 55% target. The remaining 85 MtCO2 is intended to reduce the EU’s GHGs in 2030 further from 55% to around 57% compared to 1990 levels.
- For example, the need for geological net zero was recognised in the recent review for the British Government of Net Zero led by Chris Skidmore MP. https://assets.publishing.service.gov.uk/government/uploads/system/uploads/attachment_data/file/1128689/mission-zero-independent-review.pdf
- https://www.cell.com/joule/pdf/S2542-4351(21)00489-X.pdf
- https://www.wri.org/insights/california-carbon-dioxide-removal-policies
- Under the proposals, credits are intended to represent carbon that is removed from the atmosphere and expected to be sequestered for 1,000 years or more (and guaranteed to be sequestered for at least 100 years). https://thehill.com/opinion/energy-environment/3916956-new-california-bill-could-advance-carbon-removal-while-holdingpolluters-accountable/
- https://www.negemproject.eu/wp-content/uploads/2023/05/D-3.2-Global-NETP-biogeochemical-potential.pdf
- Howard Herzog, in Greenhouse Gas Removal Technologies, Edited by Mai Bui and Niall Mac Dowell, Royal Society of Chemistry, 2022
- https://www.iea.org/reports/direct-air-capture
- https://www.iea.org/reports/ccus-around-the-world/dac-1
- E. Rubin, C. Short, G. Booras, J. Davison, C. Ekstrom, M. Matuszewski, and S. McCoy, International Journal of Greenhouse Gas Control, 2013, 17, 488.
- We apply the formula: $/t net CO2 removed = $/t gross CO2 removed / (1 – x) where x = (lifecycle CO2 emitted by DACCS / gross CO2 captured by DACCS). The formula is valid only if x≤1. If x>1, then the DAC process produces no negative emissions, but is a CO2 emitter.
- https://ieaghg.org/publications/technical-reports/reports-list/9-technical-reports/1058-2021-05-global-assessmentof-daccs
- Summary for Policymakers in: Global Warming of 1.5°C. An IPCC Special Report on the impacts of global warming of 1.5°C above pre-industrial levels and related global greenhouse gas emission pathways, in the context of strengthening the global response to the threat of climate change, sustainable development, and efforts to eradicate poverty, 2018
- S. Fuss, W. Lamb, M. Callaghan, J. Hilaire, F. Creutzig, T. Amann, T. Beringer, W. de Oliveira Garcia, J. Hartmann, T. Khanna, G. Luderer, G. Nemet, J. Rogelj, P. Smith, J. Vicente Vicente, J. Wilcox, M. del Mar Zamora Dominguez, and J. Minx, Environmental Research Letters, 2018, 13, 063002
- https://ieaghg.org/ccs-resources/blog/new-ieaghg-report-global-assessment-of-daccs-costs-scale-andpotential#:~:text=NOAK%20DACCS%20costs%20in%20the,performance%20assumptions%20and%20favourable%20 conditions.
- Costs are converted at $1.30/£. https://www.element-energy.co.uk/wordpress/wp-content/uploads/2022/06/BEISEngineered-GGR-policies-FINAL-REPORT.pdf
- https://www.energyintel.com/00000189-088a-dde9-a7df-caaec7720000
- Negative Emissions Technologies and Reliable Sequestration: A Research Agenda, The National Academies Press, Washington, DC, 2019.
- https://www.cleanenergyministerial.org/sites/default/files/2020-04/CCUS%20-%20Direct%20Air%20Capture%20 webinar.pdf. page 35
- https://www.reuters.com/world/us/facing-brutal-climate-math-us-bets-billions-direct-air-capture-2023-04-18/
- https://network.bellona.org/content/uploads/sites/3/2020/10/Longship-Briefing_Bellona-1.pdf
- https://www.globalccsinstitute.com/wp-content/uploads/2021/03/Technology-Readiness-and-Costs-for-CCS-2021-1. pdf See figure 11.
- https://www.pnas.org/doi/10.1073/pnas.1012253108
- This is often expressed as Wright’s law.
- https://ourworldindata.org/learning-curve
- https://www.globalccsinstitute.com/wp-content/uploads/2021/03/Technology-Readiness-and-Costs-for-CCS-2021-1.pdf
- In the two-factor model, total costs are divided into energy costs and non-energy costs. Energy costs are assumed to be about 20-25% of the total in 2030. Energy price changes are assumed to be driven exogenously by wider market trends, with a defined percentage reduction each year. Non-energy costs are treated as in the single factor model, reducing based on deployment of DACCS.
- https://www.youtube.com/watch?v=roGisRTQW78
- Schmidt O, Hawkes A, Gambhir A and Staffell I 2017 The future cost of electrical energy storage based on experience rates Nat.Energy 2 17110
- Rubin E S, Azevedo I M L, Jaramillo P and Yeh S 2015 A review of learning rates for electricity supply technologies Energy Policy 86 198–218
- Fukui R, Greenfield C, Pogue K and van der Zwaan B 2017 Experience curve for natural gas production by hydraulic fracturing Energy Policy 1 263–8
- Rubin E S, Yeh S, Hounshell D A and Taylor M R 2004 Experience curves for power plant emission control technologies Int. J. Energy Technol. Policy 2 52
- Yeh S and Rubin E S 2007 A centurial history of technological change and learning curves for pulverized coal-fired utility boilers Energy 32 1996–2005
- Rubin E S, Yeh S, Antes M, Berkenpas M, Davison J 2007 Use of experience curves to estimate the future cost of powerplants with CO2 capture International Journal of Greenhouse Gas Control 1 188–197
- The DoE announcement refers to “up to” and “over” 1Mt p.a. respectively. These appear to refer to gross rather than net removals as there is not mention of Lifecycle analysis.
- https://www.globalccsinstitute.com/resources/global-status-of-ccs-2022/ Data excludes the In Salah project which ceased operation.
- https://www.iea.org/fuels-and-technologies/carbon-capture-utilisation-and-storage
- GCCSI, Global Status of CCS 2022 Report, Facilities List
- The CCUS Hub (ogci.com)
- https://www.sciencedirect.com/science/article/abs/pii/S0040162513002096
- https://www.nature.com/articles/462568a
- https://www.sciencedirect.com/science/article/pii/S254243512200410X
- https://www.iea.org/energy-system/renewables/solar-pv
- https://www.eia.gov/energyexplained/electricity/electricity-in-the-us.php
- This comparison excludes transport of naturally occurring CO2.
- Correspondence with the authors.
- Indicative shares are based on discussions with industry participants.
- Based on a decrease in weighted average cost of capital from 7% to 5%, real pre-tax.
- Source: Clean Air Task Force. https://www.catf.us/resource/carbon-capture-inflation-reduction-act/#:~:text=The%20 Inflation%20Reduction%20Act%20of,carbon%20capture%20and%20storage%20technologies.
- Grubb, M., & Newbery, D. (2018). UK electricity market reform and the energy transition: Emerging lessons. The Energy Journal, 39(6). https://www.eprg.group.cam.ac.uk/wp-content/uploads/2018/06/1817-Text.pdf
- Assuming capital costs are 63% of total levelized cost, and require rate of return reduces from 5% to 4% (real terms, pre-tax).
- https://pubs.rsc.org/en/content/articlehtml/2022/ee/d1ee03523a


