Lahendong Geothermal Plant in Manado, North Sulawesi Province, Indonesia. Valuing the climate benefits of geothermal projects in Ulubelu and Lahendong attracted funding from the World Bank and the Clean Technology fund, making the projects competitive with equivalent coal power plants.
Executive Summary
The world invests almost twice as much in clean energy as it does in fossil fuels but there are major imbalances in investment. Despite rapid growth in energy demand, Emerging Markets and Developing Economies (EMDEs) outside China receive only 15% of global clean energy investments. This is the result of a combination of two factors prevalent in many EMDEs: limited resources seeking maximum development impact, and the high cost of capital that frustrates global financing for clean energy projects. Ongoing investment in fossil fuels in EMDEs, that is locking in carbon-intensive infrastructure, threatens to offset emission reductions achieved in advanced economies. Under current policies, EMDEs will fail to decarbonize and switch to renewables even at the pace necessary to meet their announced pledges, and well short of what is required under the Net-Zero scenario. Addressing this imbalance requires innovative financial mechanisms that bridge the gap between development needs and climate goals.
This paper proposes disentangling development and climate impacts as a way to mobilize more financing for green infrastructure in EMDEs. The goal of development investment is to catalyze local economic growth, while the goal of climate investment is to deliver global benefits by reducing greenhouse gas emissions. By clearly delineating the benefits, costs, and risks associated with these two objectives, it becomes possible to create a financing solution that allocates the development component of the green infrastructure project to local and development investors who prioritize socio-economic outcomes, while the climate component is directed to global climate investors seeking measurable emissions reductions and climate benefits.
The Green Swap is a financial instrument based on this disentanglement. It leverages the lower global cost of capital to finance the incremental costs of adopting green technologies, leaving local or development resources to fund the development aspects of infrastructure projects. By aligning the financial structure with the distinct objectives of development and climate, the Green Swap makes green investments viable. Furthermore, it fosters collaboration between local and global investors, addressing the dual mandates of development and climate action.
Real-world applications underscore the Green Swap’s practicality and potential. For example, geothermal projects in Indonesia, wind power in India, and coal plant decommissioning in Chile illustrate how valuing the carbon benefits of green projects can mobilize global finance to bridge the cost gap. These cases demonstrate the versatility of the Green Swap in various contexts, highlighting its ability to adapt to diverse sectors and geographies.
The implications of disentangling development and climate finance extend beyond individual projects. This approach enhances transparency and accountability in resource allocation, ensuring that climate funds are directed toward their intended purposes without diluting development priorities. Furthermore, clearly identifying the incremental costs of green investments will allow policymakers to better assess the need for dedicated climate resources.
1. Introduction
Two statistics, when juxtaposed, outline one of the fundamental challenges in unlocking adequate and appropriate climate finance. On one hand, 92% of the Sustainable Development Goals can be achieved through investment in infrastructure.1 On the other hand, current and future investment in two infrastructure sectors – electricity production and the transport sector – is expected to generate almost half of all greenhouse gas emissions globally.
The tradeoff between enabling development and curtailing climate impact has created divergent policy goals and erected significant impediments to mobilizing climate finance. Yet investment in infrastructure tie the two together. Advanced economies increasingly require that all infrastructure investment be climate friendly; EMDEs prefer to reap infrastructure’s positive externalities for development first, shifting a reckoning of its negative climate impact to others, or for a later stage in their development trajectory. Diplomatic efforts and policy initiatives to reconcile these two goals have had limited success. Development finance institutions (DFIs), straddling the climate priorities of donor countries and the development priorities of recipient countries, often bear the brunt of this tradeoff.
In this paper, we argue that disentangling the risk and return of climate impact from the hazards and rewards of development impact can widen the pool of resources for mobilizing climate finance. By its very nature, the direct fruits of development finance are domestic: they accrue largely to domestic stakeholders and are tied closely to the domestic commercial and political risks of the country in which the investment is made. Local investors can unlock most of the development benefits of infrastructure from brown investments and find the incremental cost of green investments prohibitively high in the absence of commensurate local benefits. On the other hand, the first order benefits of climate mitigation finance are manifested in the abatement of greenhouse gases, whose beneficial impact is distributed globally. Yet global investors, seeking to capitalize on the rewards and risks of green investments, are frustrated by the high cost of undertaking the commercial and political risks that seem intrinsic to infrastructure investment in emerging economies.
At the heart of this paper is the Green Swap, a financial instrument designed to operationalize this disentanglement. The Green Swap allows local investors to fund the basic costs of infrastructure while global climate finance covers the incremental costs and risks associated with green technologies. This approach leverages the lower global cost of capital to make green projects financially viable, aligning local development priorities with global climate goals. By doing so, the Green Swap bridges the gap between development and climate goals, creating a scalable financing framework for sustainable infrastructure investment.
The following sections explore these ideas in greater depth. Section 2 examines the structural barriers to decarbonization in EMDEs, including high costs of capital and reliance on fossil fuels. Section 3 introduces the theoretical foundation for disentangling development and climate finance, while Section 4 details the mechanics of the Green Swap. Section 5 provides real-world applications, such as geothermal projects in Indonesia and wind power in India, demonstrating the practicality of the Green Swap. Finally, Section 6 discusses the broader implications of disentangling development and climate finance, advocating for a transparent and equitable allocation of resources to meet global climate and development goals.
2. The Challenge of Decarbonization in Emerging Markets and Developing Economies
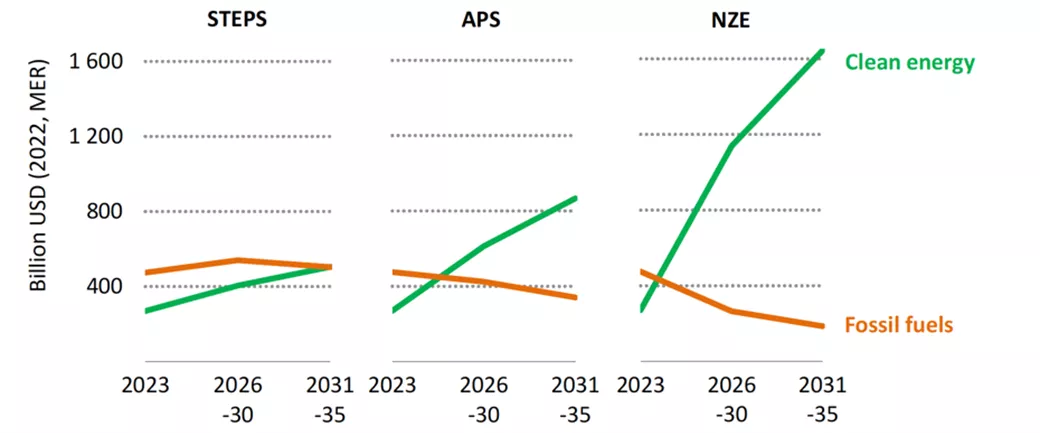
The world now invests almost twice as much in clean energy as fossil fuels, but there are major imbalances in investment. EMDEs outside China account for only around 15% of global clean energy spending,2 even though their electricity demand is growing faster than in advanced economies. Under current policies, EMDEs will fail to decarbonize and switch to renewables at the pace necessary to meet their announced pledges and remain well short of the level of clean energy investment required under the Net-Zero scenario (Figure 1).3
Figure 1: Annual average clean energy and fossil fuel investment in EMDEs by scenario. Source: International Energy Agency, 2024, Reducing the Cost of Capital. Stated Policies Scenario (STEPS): Reflects current policy settings and firm commitments. Announced Pledges Scenario (APS): Assumes full implementation of all national energy and climate targets. Net Zero Emissions by 2050 (NZE) Scenario: Outlines a pathway to limit global warming to 1.5°C.
2.1. Fossil Fuel Investments
In fact, EMDEs have continued to invest in fossil fuel-based power to meet their growing demand for reliable and inexpensive electricity. Between 2012 and 2021, EMDEs built over 540 GW of net fossil fuel capacity and attracted an estimated $570 billion in new fossil fuel investments. In 2021 alone, nearly half of EMDEs’ total new power-generating capacity investment was directed toward fossil fuels. Of this, 46% went to coal production, locking in substantial fossil fuel capacity for decades. Countries like India, Egypt, Saudi Arabia, Indonesia, Vietnam, and Iraq have driven this trend, with India alone adding 107 new coal projects over the last decade.4
And this trend is projected to persist. Despite India’s significant push for renewable energy, coal will remain a cornerstone of its energy strategy due to rising demand. Under current policies, fossil fuels will account for around 30% of India’s total electricity generation through 2050 (Table 1).5
Table 1. TWh of electricity generation in India under the IEA's Stated Policies Scenario (Source: IEA's World Energy Outlook 2024)
Years
Coal
Natural Gas
Renewables
Nuclear
2010
658
107
181
26
2022
1,307
55
585
46
2023
1,419
64
624
48
2030
1,640
84
1,725
128
2035
1,457
107
3,097
201
2050
865
164
7,786
337
Total
7,346
582
13,999
785
A similar pattern is evident in Southeast Asia, where countries such as Indonesia and Vietnam continue to invest heavily in fossil fuels. Fossil-fuel-fired electricity generation in the region is expected to grow, accounting for 50% of total electricity generation by 2050, driving substantial emissions (Table 2).6
Table 2. TWh of electricity generation in Southeast Asia under the IEA's Stated Policies Scenario (Source: IEA's World Energy Outlook 2024)
Years
Coal
Natural Gas
Renewables
Nuclear
2010
185
336
104
--
2022
568
336
408
--
2023
615
349
415
--
2030
760
526
701
--
2035
808
607
1,192
--
2050
815
715
3,018
41
Total
3,752
2,869
5,838
41
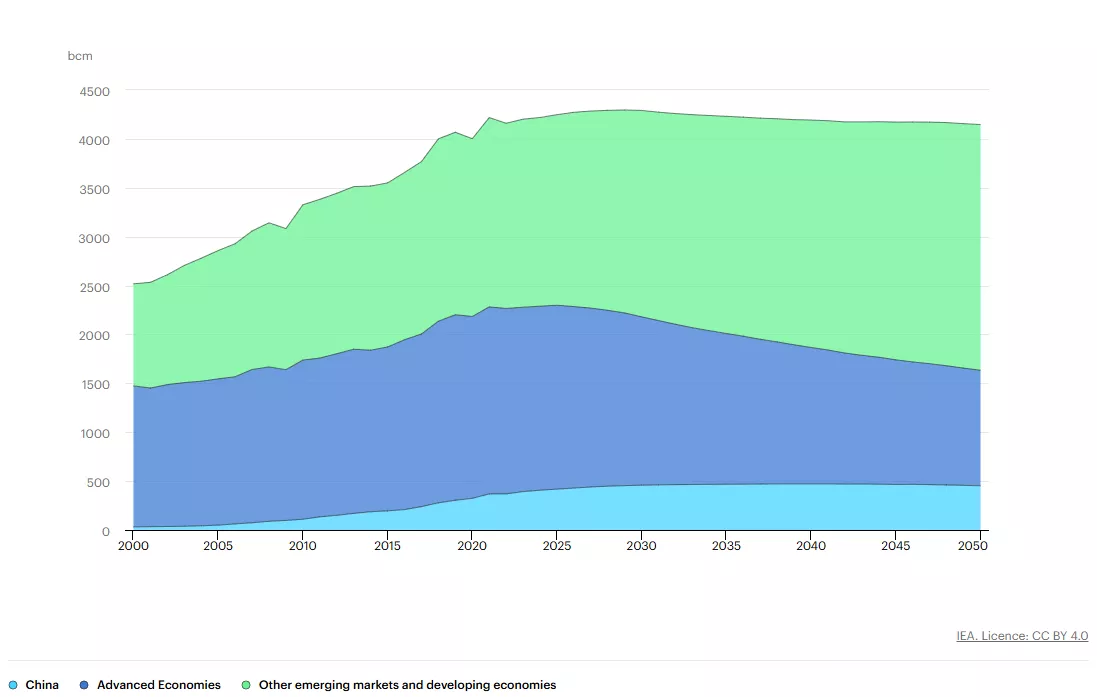
In addition to electricity generation, the expansion of fossil fuel capacity in EMDEs is expected to persist. Between 2024 and 2050, over $35 trillion (~56%) of energy investment is expected to flow into fossil fuels in these regions.7 As EMDEs continue to invest in fossil fuels to meet their voracious demand for plentiful and cheap energy, the International Energy Agency (IEA) projects that under the Stated Policies Scenario, fossil fuel demand in EMDEs will almost entirely offset the reductions achieved in the advanced economies8 (Figure 2).
International Energy Agency
Figure 3.1. Natural gas demand in the IEA's Stated Policies Scenario (2000-2050). Source: International Energy Agency, 2023, World Energy Outlook 2023, Executive Summary.
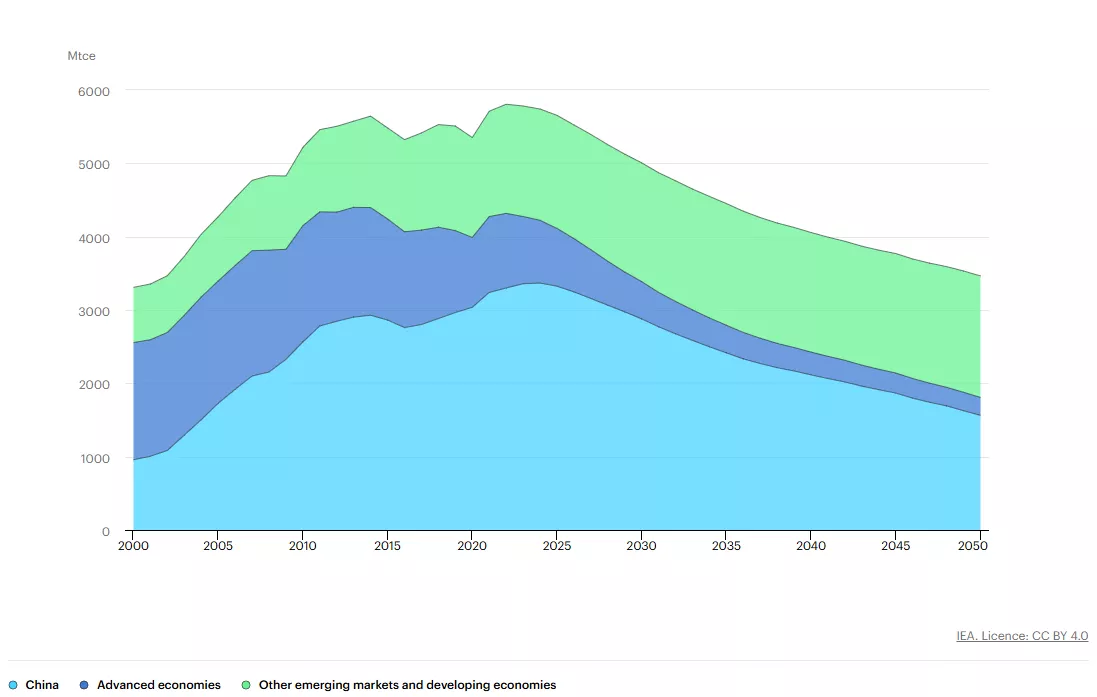
International Energy Agency
Figure 3.2. Coal demand in the IEA's Stated Policies Scenario (2000-2050). Source: IEA, 2023, World Energy Outlook 2023, Executive Summary.
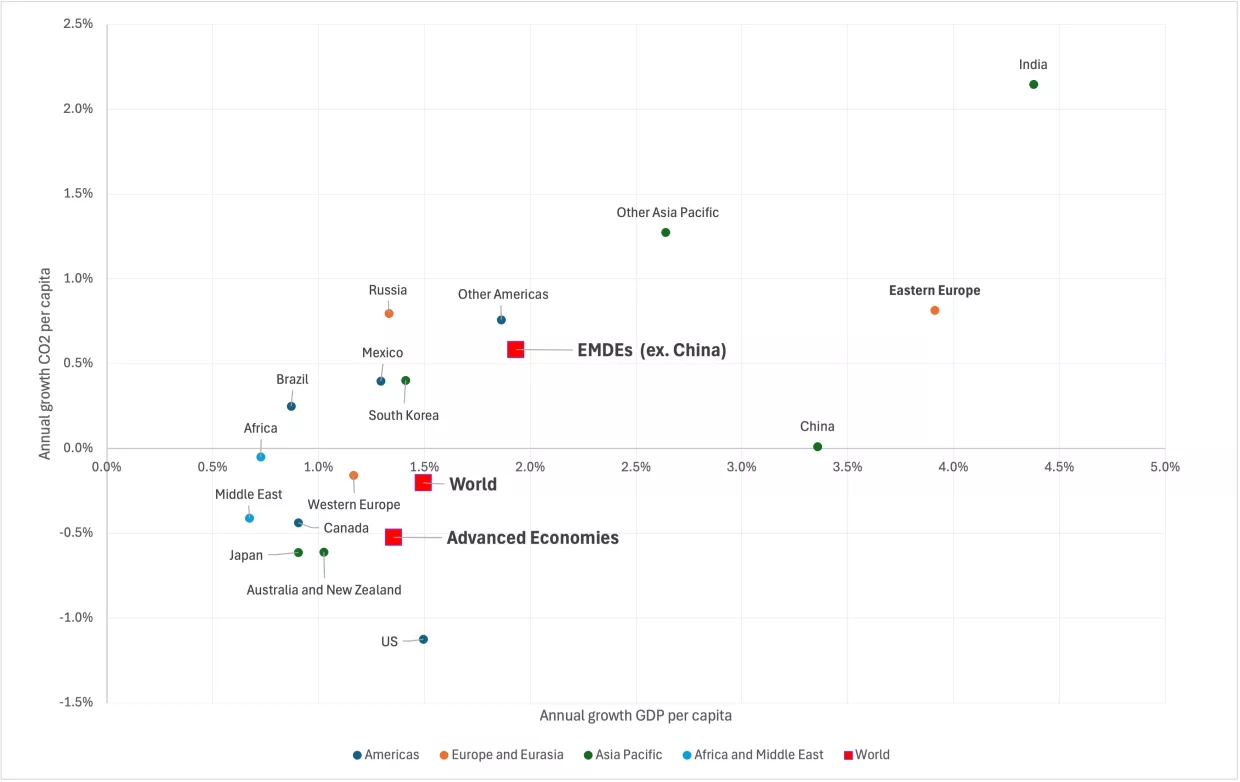
On a per capita basis, emissions in EMDEs (excluding China) are expected to grow annually by 0.6% between 2022 and 2050, compared to a -0.5% rate in advanced economies. Factors such as economic growth, urbanization, and industrialization drive this increasing energy demand.9 Historically, fossil fuels have been the most accessible and cost-effective solution, creating a cycle where economic growth has been accompanied by higher emissions (Figure 3).
U.S. Energy Information Administration, Oxford Economics
Figure 3. Projected annual GDP and CO2 emissions growth per capita, 2022-2050. Source: U.S. Energy Information Administration, World Energy Projection System (2023), run r_230822.081459 and Annual Energy Outlook 2023 (March 2023), www.eia.gov/aeo; Oxford Economics, Global Economic Model (February 2023), www.oxfordeconomics.com (subscription site).
Breaking this cycle requires substantial investments in clean energy infrastructure so that rapid development does not come at the cost of adverse climate impact, even as climate goals do not stifle development.
Some of the reasons that have been offered for the slow decarbonization of EMDEs are their high costs of capital coupled with the relatively higher upfront investment costs required for clean energy projects.
2.2. The High Cost of Capital
EMDEs need access to substantial capital, both from domestic and international sources, to fund the transition to sustainable energy systems. One of the critical impediments to global financing of the energy transition is the high cost of capital in EMDEs.10
The IEA estimated that the cost of capital for solar PV projects in EMDEs such as Brazil, India, Indonesia, Mexico, and South Africa is more than twice as high as in Europe and the United States (Table 3). This is reflected in the higher cost of equity and debt in EMDEs, as well as a conservative capital structure that relies on more equity.
Table 3. Indicative weighted average cost of capital of utility-scale solar PV projects, 2021. Notes: WACC = weighted average cost of capital. Values are expressed in local currency. The values for Brazil, India, Indonesia, Mexico, and South Africa are based on the survey of the Cost of Capital Observatory. Source: IEA, World Energy Outlook 2022.
Region
Costs of debt (after tax)
Cost of equity
Share of project debt
WACC (nominal, after tax)
Europe
2.5 - 3.0%
6.0 - 11.0%
75 - 85%
3.0 - 5.0%
United States
3.0 - 3.5%
5.0 - 7.0%
55 - 70%
3.5 - 5.0%
China
3.5 - 4.0%
7.0 - 9.0%
70 - 80%
4.0 - 5.5%
Brazil
11.5 - 12.0%
15.0 - 15.5%
55 - 65%
12.5 - 13.5%
India
8.0 - 9.0%
12.5 - 13.5%
65 - 75%
9.0 - 10.5%
Indonesia
8.5 - 9.5%
12.0 - 12.5%
60 - 70%
9.5 - 10.5%
Mexico
8.0 - 8.5%
12.0 - 12.5%
60 - 70%
9.5 - 10.0%
South Africa
8.0 - 9.0%
12.0 - 14.0%
65 - 70%
9.5 - 11.0%
The cost of capital for onshore wind projects, as well as that for gas projects, reflects a similar pattern. According to the International Renewable Energy Agency (IRENA), these differences in capital costs are driven more by regions than by the technology itself, emphasizing the unique financial challenges EMDEs face.
Such high costs of capital make it difficult for global investors to justify investments in EMDEs, as the risks associated with these regions often exceed their risk appetite. Furthermore, the elevated regional costs translate into reduced financial returns, making projects less attractive than similar opportunities in advanced economies.
2.3. The High Upfront Costs of Clean Energy Projects
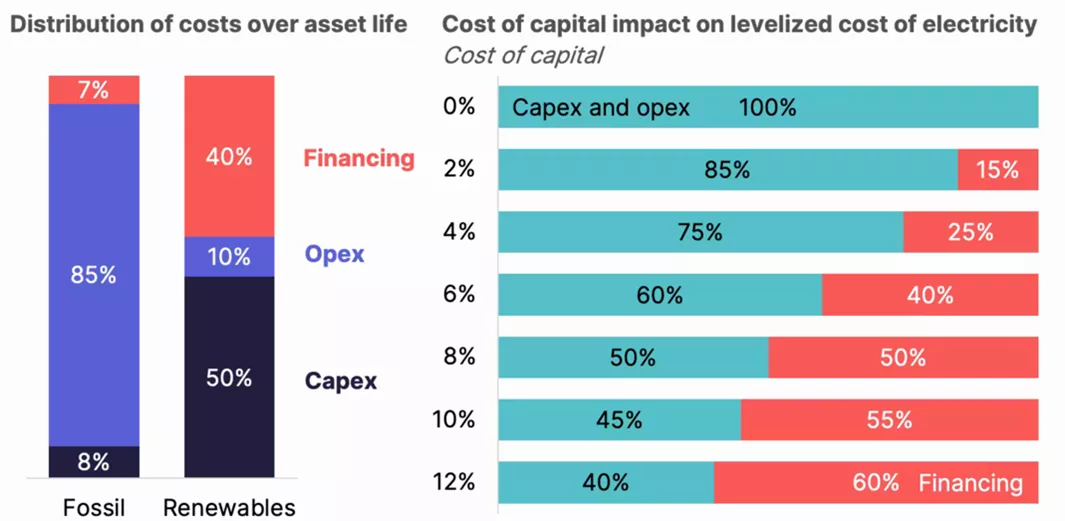
Although the levelized unit costs of generating renewable energy have been declining, the higher upfront capital requirements for renewable energy projects remain a significant deterrent to green investments.11 In EMDEs, fossil fuel projects are often favored because they require lower initial investments and provide more predictable returns, making them more attractive in high-cost environments. These higher upfront costs for renewables also amplify the role of financing costs12 as a critical component of the total cost of electricity generation (Figure 413). As a result, the financial burden of high capital costs has far-reaching implications for the viability of renewable energy projects.
Regulatory Assistance Project/Nat Bullard
Figure 4. Cost composition of different power generation technologies. Data source: Regulatory Assistance Project. Image source: Nat Bullard. Reprinted with permission.
This combination of high capital costs, the appeal of the lower upfront costs of fossil fuel-based generation, and the reluctance of global investors due to risk perception forms a significant barrier to the energy transition in EMDEs. The high cost of capital and the commensurate risks have discouraged global investors from investing in clean-energy projects in EMDEs. At the same time, EMDEs can unlock most of the development benefits associated with infrastructure development and power generation from fossil-fuel investments; they find the incremental costs of financing clean energy investments from scarce development resources prohibitively high.
Given the significant deterrent that the high cost of capital has proved to be, it is not surprising that much effort has been spent in trying to lower this cost and the risks underlying it.14
Therefore, concessional and blended finance has been the choice of many interventions, while others have relied on derisking green energy projects in EMDEs. However, the scale of resources required to achieve such a reduction in EMDEs is immense and exceeds the capacity of any single institution or fund.
3. Disentangling Climate and Development Impact
Clean energy projects in EMDEs look towards both domestic and international capital. However, domestic capital to finance large-scale renewable energy projects independently is limited. International sources are seen as crucial in filling this financing gap. Yet, according to the IEA, international sources contribute only one-quarter of the primary finance for energy investments in EMDEs.15
Most of this international financing comes from multilateral development banks (MDBs) and bilateral development finance institutions (DFIs). Ninety percent of it has taken the form of debt followed by small amounts of grants and some equity.16 Another instrument that has been proposed to mobilize blended finance for EMDEs is cross-border guarantees17 that serve to derisk projects against risks such as regulatory, offtake, political and currency risks. However, so far guarantees have not been utilized to a significant extent for mobilizing climate finance.18
MDBs and DFIs derive their funding from the Official Development Assistance (ODA) contributions of developed countries. As climate change has risen to prominence on global agendas, those countries are increasingly using this ODA to fund climate-related projects in EMDEs with the hopes of tackling climate goals and development objectives simultaneously.
From 2019-2022, DFIs disbursed on average around USD 24 billion each year in finance for energy sector projects, 80% of which was for clean energy projects.19 At first glance, this integrated approach seems to make sense given the close overlap between climate and development.
However, the development and climate impact of infrastructure differ in their benefits, costs, and risks (Table 4).
Table 4. Development and climate impact: comparing benefits, costs, risks, and finance
Development
Climate
Benefits
Localized socio-economic improvements, enhancing living standards, reducing poverty
Generation of global public goods, chiefly in the form of avoided GHG emissions
Costs
Lowest cost option using scarce development resources or exceeding the high cost of capital
Higher incremental cost associated with achieving additional climate benefits
Risks
Local investment risks: political instability, regulatory changes, and economic volatility
Global risks of clean energy: technology, climate agreements, carbon economy
Finance
Subsidized development finance, from local investors and development actors
Typically funded by global investors at a lower cost of capital in global markets
Development benefits are domestic or local, seeking to catalyze economic activity and raise living standards. The primary goal of development is to generate socio-economic improvements within a specific region, focusing on projects that directly impact domestic stakeholders through poverty alleviation, infrastructure development, healthcare, and education. In contrast, the most significant share of climate benefits takes the form of global public goods through the avoidance or reduction of greenhouse gas (GHG) emissions.
Development by itself seeks infrastructure with the lowest upfront cost to be able to stretch scarce development resources the farthest. As a result, many EMDEs have chosen to invest in fossil fuel-based projects over green investments. Climate investors are more willing to finance the higher cost of green infrastructure in anticipation of the resultant climate benefits.
Finally, the bulk of infrastructure risks – regulatory, offtake, political and currency – emanate from local development. The political, social, and commercial risks inherent in EMDE infrastructure investments have deterred global climate investors as their magnitude is large. But these are not climate-related risks. These are development-related risks, and they are largely present in both brown and green infrastructure projects. With scant ability to control them, climate investors have little appetite for these risks and therefore have shunned green infrastructure investments in EMDEs. The major risks of greening infrastructure are instead related to technology, climate agreements, and the carbon economy, and it is these risks that should be borne by the climate investor.
Finance seeks to reap the benefits that come in exchange for assuming the cost of investments and bearing the embedded risks. If development and climate differ in their benefits, costs, and risks, so must their financing.
Development finance should be that finance whose primary focus is unlocking the mostly local social, economic, political, and cultural growth that we call development. It should pay only for the cost of development. And it should bear all the risks of development.
Climate finance should only pay for the incremental cost and additional risks of making development green. And it should do so in anticipation of reaping the mostly global climate benefits that arise from making green investments.
A companion paper20 of this research project describes the economic argument for disentangling climate and development impact and establishes its financial viability.
We believe that a significant reason for the failure to mobilize sufficient financing for green infrastructure in EMDEs is the misalignment between climate and development impact. Disentangling climate impact from development impact can help address the dual mandates of development and climate simultaneously and mobilize private capital for green investments in EMDEs. The Green Swap is the type of financial instrument that would implement this.
4. The Green Swap
We believe that a significant reason for the failure to mobilize sufficient financing for climate friendly infrastructure in EMDEs is the misalignment between climate and development impact. Disentangling climate impact from development impact can help address the dual challenges of incentivizing local investment for development and mobilizing global financing to ensure that the investment is green. The result would be the realization of climate-friendly infrastructure that is economically and financially viable, and that avoids the adverse climate impact of carbon-intensive infrastructure. In this section we propose a financial instrument that can achieve this, the Green Swap.
We introduce the idea behind the Green Swap using a simple stylized example and discuss some of the main steps in implementing it. An illustration of how the Green Swap might work in practice using some calibrated examples of infrastructure investments in the power generation sector follows in the next section.
4.1. A Simple Stylized Example
Consider an infrastructure investment in an emerging economy. Assume that the domestic or local (opportunity) cost of capital in the emerging economy for making infrastructure investments in the country is 20% per period, while the cost of capital in global markets is 5% per period. The high local cost of capital reflects the high risks of investing in the emerging economy that arise from the political, economic regulatory, and currency risks that its investments are subject to.
In the example, there are two periods: the infrastructure investment is made in the first period, and the impact of that investment is realized in the following period. There is no uncertainty. Furthermore, the same development benefits can be obtained using either a carbon-intensive-technology-based infrastructure project or a climate-friendly-technology-based infrastructure project. We label these two distinct projects 'brown' and 'green' respectively.
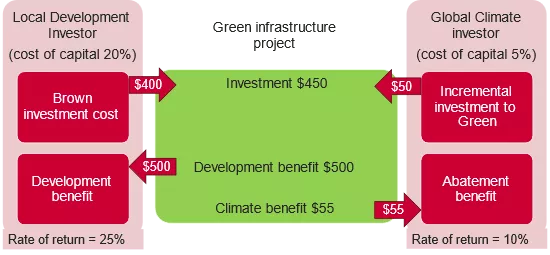
Suppose the development impact from either investment is valued at $500 million. If the investment required for the brown project is $400 million, the economic return from the brown investment would be 25%. This return being higher than the 20% opportunity cost of capital would make the brown investment economically viable. In other words, the emerging economy would undertake the brown investment using whatever investment resources it has access to. These might include local public resources as well as global development resources. They might also attract private capital that has an appetite for the development related risks of investing in the emerging economy in exchange for a return of more than 20% as measured by the cost of capital.
On the other hand, suppose the investment required for the green project is $450 million. The economic return from the green investment would be only 11%, making the investment less attractive relative to the brown option. Financing this option using local public resources would be suboptimal, and doing so using scarce global development resources would require a significant subsidy that might crowd out other development priorities. Of course, mobilizing private capital would not be financially viable either.
Figure 5 shows the development impact, cost and viability of the brown and green technology-based infrastructure investment choices.
Figure 5. Illustrative example showing non-viability of green investments
Brown
Green
Impact
500
500
Costs and risks
(400)
(450)
Return
25%
11%
Financing cost
Local cost of capital = 20%
Viable?
YES
NO
However, choosing the green investment has an additional benefit: it avoids the emissions that the brown investment would generate. Suppose these climate benefits are valued at $55 million. These benefits can be realized only by choosing the $450 million green technology instead of the $400 million brown technology. In other words, the climate benefit of $55 million can be realized only by incurring the incremental cost of $50 (= $450-$400) million.
Figure 6 shows the incremental climate-related benefit and the incremental cost of the green investment. The embedded rate of return is 10% per period. It is easy to see that the incremental investment remains non-viable at the 20% local cost of capital in the emerging economy. However, if the climate benefits can be realized independently of (or insulated from) local project risks, the appropriate cost of capital would be closer to the global cost of capital, which is typically much lower and assumed to be 5% per period in our example.
Figure 6. Delinking the costs and risks of abatement
Development
Climate
Brown
Green
Green
Benefit
500
500
55
Costs and risks
(400)
(450)
(50) incremental cost of green
Return
25%
11%
10%
Financing cost
Local CoC = 20%
Global CoC = 5%
Viable?
YES
NO
YES
The climate benefit may be monetized through global carbon markets or equivalent regulatory mechanisms in advanced economies that recognize the global climate benefits of adopting green technology-based infrastructure investment in the emerging economy.
Figure 7 illustrates the Green Swap mechanism in more detail. This mechanism enables local and development investors to finance the foundational costs of infrastructure projects—costs that are equivalent to what they would incur for brown projects—while global investors are brought in to fund the incremental costs necessary to transition these projects from brown to green. By doing so, the Green Swap leverages the lower global cost of capital for climate-related investments, directing global finance towards the climate benefits while leaving local development resources to invest in and benefit from local development outcomes.
Akash Deep et al.
Figure 8. Delinking the costs and risks of abatement.
This disentangling of development benefits, costs and risks from climate benefit costs and risks allows the sourcing of development and climate finance from different sources even though they are deployed for developing the same infrastructure project. However, combining global finance with local finance transforms the previously unviable green project into a globally viable climate investment and a locally viable development investment.
The Green Swap is a financial instrument designed to facilitate green investment by reallocating financial obligations, benefits, and the attendant risks between investors. What is being swapped is the financial exposure: the global investor takes on the additional costs of the green project in return for its environmental benefits, while the development investor secures the development benefits without directly investing in the green project. This structure mimics the mechanics of a financial swap, allowing both investors to share in the costs and benefits of green investments.
4.2. Specifying the Benchmark
The Green Swap mobilizes financing for building the green project and thereby prevents the creation of the brown project. Implementing the Green Swap mechanism requires a description of what the infrastructure project’s benefits, costs and risks would look like if it were developed as a brown investment. In other words, the Green Swap treats the brown project as the benchmark against which the incremental costs and risks of the green project must be measured.
Clearly specifying the brown benchmark serves several purposes. First, it allows the identification of purely development-related benefits, costs and risks as described earlier and thus helps disentangle them from climate impact. Furthermore, it ensures that for an infrastructure project to attract climate finance, its brown equivalent is not only feasible from a development perspective but also financeable using available development resources.
The brown benchmark also represents a distinct methodological perspective. The approach that has usually been proposed (see, for example, IEA’s Cost of Capital Observatory) to evaluate the viability of the green investments is to measure its internal rate of return against a cost of capital hurdle. The brown benchmark provides a more realistic measure of the financing gap that needs to be bridged.
The specific parameters of the brown benchmark are not difficult to articulate in the case of many EMDEs where a sizeable fraction of investments are still being directed towards fossil-fuel-based investments. Thus, the brown benchmark also serves as a useful reference point to establish the additionality of climate investments.
4.3. Rewarding Climate Benefits
The brown counterfactual also allows for the quantification of the climate benefit which, in the case of mitigation projects, arises largely from the emissions avoided by opting for a green project over a brown one. Tools such as IRENA’s Avoided Emissions Calculator21 can be used to quantify these GHG reductions, providing a clear metric of the climate impact that can be directly linked to the Green Swap mechanism.
Finally, the Green Swap relies on sourcing a return for the climate benefits through mechanisms that recognize and associate a value with such benefits. By separating the climate benefits from the local political, economic, regulatory and currency risks of the projects that they emanate from, these benefits are not tied to specific geographies. This independence is crucial, as it allows global investors to focus solely on climate benefits.
Such benefits can be recognized, valued, and traded in carbon markets alongside other comparable carbon reduction mechanisms. There are opportunities to establish a robust market at scale for emission reductions, which remains an area requiring significant development.22 While it is possible to provide incentives and address transition barriers to facilitate these mechanisms, substantive progress in this direction has yet to be realized.
A companion paper23 of this research project explores the current state of carbon markets to monetize abatement benefits for global investors looking to fund climate projects in EMDEs.
5. Illustrating the Viability of the Green Swap
Real-life examples illustrate the viability of the Green Swap. A geothermal energy development project in Indonesia demonstrates how explicitly valuing the emission reductions can transform a climate friendly but financially unviable project into an attractive investment from both local and global perspectives. Initially, the geothermal project faced higher costs and lower returns compared to coal, making it less competitive. However, when the carbon benefits of the project were factored in, the project became economically viable. For the Green Swap, the climate benefits of the carbon abatement would be sufficient to attract financing from global investors to fund the incremental costs of the geothermal project.
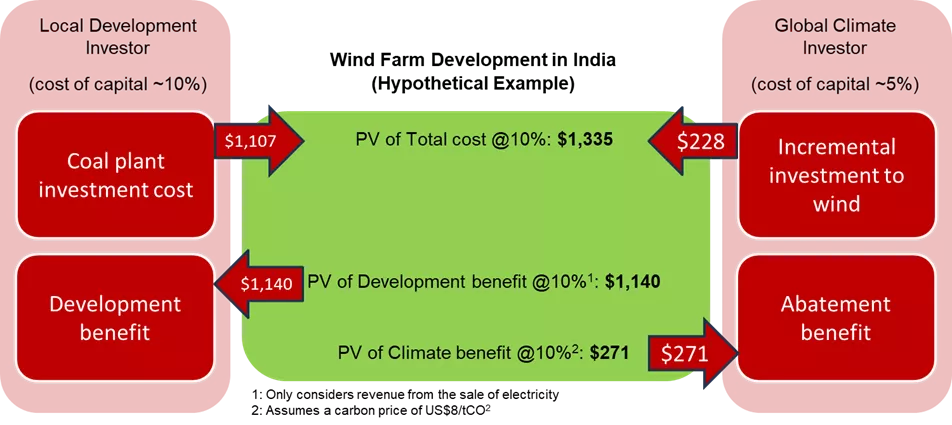
Similarly, the analysis of wind power projects in India underscores how carbon pricing can enhance the financial attractiveness of clean energy projects. Without carbon pricing, these projects struggle to compete with coal in terms of returns. However, when carbon prices from established markets like the EU-ETS and California’s Cap-and-Trade Program are applied, the returns on solar and wind projects increase significantly, making them viable options for global investors. This scenario aligns with the Green Swap framework by showing how carbon finance can bridge the financial gap, making clean energy projects competitive with traditional fossil fuel-based power generation.
The decommissioning of coal plants in Chile provides another practical application of the Green Swap. In this case, the carbon savings from the early retirement of coal plants were monetized to finance a wind farm, demonstrating how the Green Swap can facilitate the transition from fossil fuels to clean energy by linking the financing to the carbon benefits generated from such transitions.
Finally, the Asian Development Bank’s Energy Transition Mechanism (ETM) in Indonesia serves as a model for applying the Green Swap at scale. By facilitating the early retirement of a coal plant through a structured transition plan and utilizing carbon markets, the ETM highlights the potential of the Green Swap to make clean energy investments financially viable while ensuring that local communities are not adversely affected by the transition.
5.1. Geothermal Energy Development in Indonesia
In 2014, Indonesia’s Ministry of Planning and its national oil and gas company Pertamina recognized the need to sustainably meet the country’s rising energy demand by developing the Ulubelu and Lahendong geothermal fields.24 At the time, over 80% of Indonesia’s electricity was generated using fossil fuels. Burgeoning demand and already high electricity tariff subsidies made the need for generating electricity at the lowest cost a priority for PLN, the state-owned electricity off-taker. Given the country’s significant geothermal development prospects, the critical question was how to make geothermal energy generation competitive relative to an equivalent coal-based project.
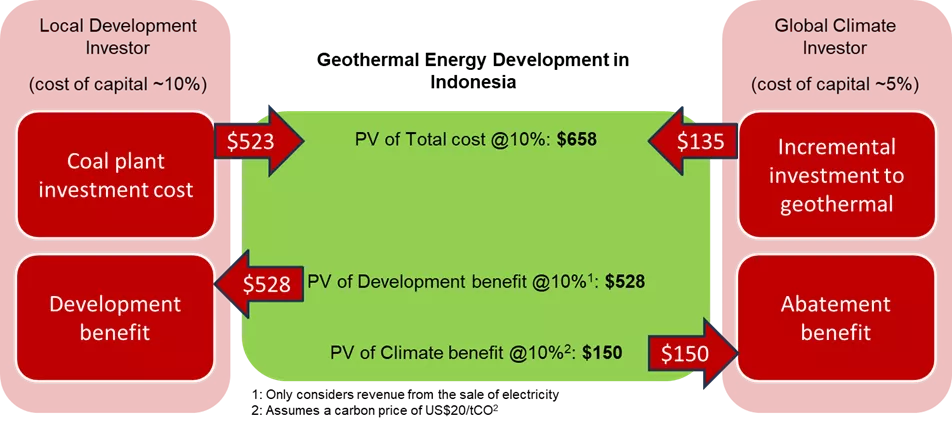
Without intervention, the development of a coal-based project was economically justified. A medium-sized coal-fired power plant was anticipated to generate 1,209 million kWh of electricity annually at an average tariff of 6.4¢/kWh applicable to coal-based projects. The present value of the investment and operational costs for such a project would have been $523 million. The $528 million present value of revenue generated at the PPA tariff of 6.4 ¢/kWh served as a lower bound of the development benefits of the power plant over its 25-year life.25 Based on this, the internal rate of return (IRR) of the coal plant was estimated to be 10.5%. In comparison, the $658 million cost to build and operate a geothermal plant of comparable size – $135 million more than the coal option – yielded an IRR of 4.9%, which would have been much lower than the cost of capital for Indonesia. The significant upfront infrastructure investment required for the geothermal fields was considered particularly burdensome. In absolute terms, the capital cost per MW of capacity was $6.5 million greater for the geothermal fields than a medium-sized coal-fired power plant. Despite the operational savings that could be attributed to a geothermal plant over its lifetime, the project was not financially competitive relative to coal.
However, this result did not consider the climate benefits of the geothermal power plant. The displacement of coal-fired power generation by geothermal power would lead to significant avoidance of carbon dioxide. The emission factor – a measure of the amount of carbon dioxide emitted per unit of energy generated – was estimated to be 1,011 Kg/MWh for coal and only 94 Kg/MWh for geothermal power plants.
At that time, the positive climate-related externalities for developing the Ulubelu and Lahendong geothermal fields over an equivalent coal plant were recognized and the project received $300 million of concessional financing from the World Bank and the Clean Technology Fund.
Applying the Green Swap would instead mobilize the financing from global climate investors provided they could disentangle and value the net climate benefits of the geothermal plan separately from its development impact. At a carbon price of $20 per tCO2e, the net present value of the geothermal project’s carbon benefits was estimated at $150 million over its lifetime. Given the geothermal plant’s incremental investment cost of $135 million, the avoided emissions-based return associated with the geothermal plant was 11%, which was higher than the global cost of capital. See Figure 8 for the simplified one-period representation of the impacts.
This relationship indicated that an international investor would see value in providing incremental investment toward greening such a power plant as long as the price of carbon is higher than $19 per tCO2e.
Akash Deep et al.
Figure 9. The Green Swap applied to Indonesia's Ulubelu and Lahendong geothermal projects.
5.2. Solar and Wind Power in India
In 2023, the Central Energy Authority in the Indian government’s Ministry of Power released a report titled Report on Optimal Generation Mix 2030 to assess the least-cost generation capacity mix required to meet the country’s projected electricity demand for the year 2029-30.26 The report provides technical and financial information on power generation in various regions of the country using renewables and fossil fuel-based technologies. The next example uses this information for exploring the financial viability of an onshore wind plant relative to coal-based generation. In 2022-23, 70.5% of India’s gross generation came from thermal plants and 4.4% from wind.
For India’s Northern Region, considering unit capital costs, operating costs, and capacity factors, we estimate the cost of solar, wind, and coal power plants with the same energy output of 3,600 GWh per year over 25 years in Table 5. Note that even though the unit (per MW) cost of coal is higher than wind and solar, the total capital expenses of wind and solar plants are higher because of their low capacity factors.
Table 5. Estimating costs of comparable wind, solar, and coal plants
Wind Onshore
Solar
Coal
Capital cost (million INR/MW)
60
45
83.4
Annual operating and maintenance cost (% of capital cost)
1%
1%
8%
Capacity factor (%)
24%
22%
63%
Installed capacity (MW)
1,700
1,900
650
Capital expenses (million USD)
1,200
1,000
650
Annual operating and maintenance expenses (million USD)
12
10
10
These hypothetical plants are practically feasible and resemble real-life examples existing in Rajasthan. The wind power plant would be nearly the size of the Jaisalmer Wind Park. The solar plant is comparable to the Badhla Solar Park, the largest in India, with 2,245 MW of capacity and a reported construction cost of USD 2.2 billion. The coal power plant is roughly equivalent to one or two generation units within power plants commissioned in the 2010s.
Regarding carbon emissions, the coal power plant would emit 3.7 MtCO2e annually and 93 MtCO2e over its 25-year lifetime based on a carbon intensity of 1,011 tCO2e/GWh.27 To study the feasibility of our mechanism, we will apply to this emission factor and the average cost of carbon in 2021-2022 for the European Union’s Emissions Trading System (EU-ETS), California’s Cap and Trade Program, and China’s National Emission Trading System (China-ETS).28 We can thus calculate the internal rate of return of the solar and wind power plants (Table 6).
Table 6. Estimating costs of comparable wind, solar, and coal plants
No carbon price
China-ETS
California Cap and Trade Program
EU-ETS
Cost of carbon (tCO2e/GWh)
-
8 $
28 $
95 $
IRR for solar
10%
18%
39%
105%
IRR for wind onshore
4%
11%
25%
69%
These findings give us a basis for examining the feasibility of the Green Swap mechanism. When climate benefits are not taken into consideration, the return on investment for wind power is estimated to be 4%, well below the cost of capital. However, even a relatively low carbon price of $8 per ton of CO2, that is prevalent in China-ETS, makes the wind plant viable while higher carbon prices such as those from California ($28) and EU-ETS ($95) reward the incremental green investment required for the wind project with significantly higher IRRs.
Akash Deep et al.
Figure 10. The Green Swap applied to wind farm development in India.
Furthermore, the Green Swap could increase the appeal of green projects, such as the solar plant in this example, that are only marginally feasible for the local development investor. The inclusion of the global investor in the project’s capital structure would not only reduce the initial outlay required from the local investor but also lower the overall cost of capital.
5.3. Decommissioning of Coal Plants in Chile
While the main objective of the Green Swap mechanism is to prevent the building of brown plants in the first place, it can also be used for the early decommissioning of fossil fuel-based plants. In such cases, the brown plant is not merely a hypothetical counterfactual but a real physical plant.
In 2020, the multinational utility company Engie and the Inter-American Development Bank (IDB) collaborated to retire two coal-based power generation units in Chile (Tocopilla plants 14 and 15) two years early and replace them with the Calama wind farm.
The monetization model for the wind farm used the carbon abated through early closure of the coal plants and its replacement with a wind farm. These resultant abatement benefits reduced the financing cost on a $15 million loan tranche from the Clean Technology Fund.29 Specifically, lenders paid Engie a floor price of $3 per ton for the carbon abated through early retirement. As 2.18 million tons of CO2 were expected to be abated during the CTF loan’s 12-year maturity, the mechanism's monetization value was estimated to be $6.54 million. In addition, if Chile introduced a carbon market over the span of the loan’s lifetime, Engie had the option to sell the emissions savings in that market while maintaining the optionality of the $3 floor price.
In this example, emissions were abated by retiring the coal plant early and replacing it with a clean energy source. Since the final price of carbon would depend upon whether a carbon market is introduced over the loan's life, the size of the final carbon return size remains to be seen. However, even at the current carbon floor of $3 per ton and the reduced financing cost of the DTF loan, the climate return was significant enough to incentivize Engie to close its coal plants early and replace them with a clean power source.
5.4. Asian Development Bank’s Energy Transition Mechanism
The Asian Development Bank (ADB) launched its Energy Transition Mechanism (ETM) in 2021 to accelerate the green energy transition in emerging Asian economies.30 The mechanism consists of public and private investment partnerships to retire coal power plants ahead of schedule. In June 2024, the ADB signed a Memorandum of Understanding in Indonesia for the early retirement of a 660 MW coal power plant owned by Cirebon Electric Power in Western Java.
The plant is currently bound by an existing power purchase agreement until 2042. The ETM will enable an early retirement in 2035, seven years ahead of schedule. From the planned closing of the transaction in 2024 to 2035, ADB will establish a transition plan to replace the plant's baseload power with clean energies at a cost lower or equal to currently contracted tariffs. The transition plan will also include core stakeholders and vulnerable groups to ensure that early retirement does not negatively impact local communities.
The Energy Transition Mechanism can provide an excellent use case for the Green Swap by enabling a direct comparison between the currently contracted tariff and potential clean energy alternative. Should no alternative emerge to provide energy at a lower cost by the plan retirement date, the Green Swap could be used to finance early retirement through carbon pricing in advanced economies. In its presentation of the ETM, the ADB also recognized that carbon markets can be used to incentivize its mechanism.
6. Additional Implications of Disentangling Development and Climate Impact
At the project level, disentangling the benefits, risks, and costs of development from those of climate creates a clear pathway for mobilizing development finance and climate finance from distinct sources. This approach enables different groups of investors to collaborate on climate-friendly projects, with each party’s contributions aligned to their specific objectives, resources, and risk appetites. Local and development-focused investors are tasked with funding the infrastructure development necessary for achieving socio-economic improvements. Meanwhile, the additional costs of adopting climate-friendly technologies to build that infrastructure to unlock the resultant global climate benefits are financed through global markets and institutions, where capital costs are lower. In this context, the Green Swap serves not only as an effective tool for mobilizing climate finance but also as an instrument of global equity and justice.
For MDBs and DFIs, which are a major source of both development and climate finance into EMDEs, our proposed delineation offers an approach to more precisely target their financial interventions. At the institutional level, distinct but complimentary processes and mechanisms could blend local and global finance and public and private resources most effectively for development and climate goals. By separating development and climate components, DFIs can concentrate their resources on their original development mandates, ensuring that their limited Overseas Development Assistance (ODA) funds are directed towards socio-economic objectives.
This is particularly important amid growing concern31 and accumulating evidence32 that current ODA methodologies and donor conditionality relating to climate impact may be crowding out33 or distorting the allocation of development finance. An approach that treats climate-related priorities, processes and resources as complementary but distinct from those for development would enhance transparency and accountability in the use of ODA.
Furthermore, measuring the incremental costs and benefits of green investments allows for a more accurate assessment of climate finance needs and the corresponding flows required to address them. By isolating the additional costs tied specifically to climate-friendly actions—such as transitioning to low-carbon technologies or implementing adaptation measures—it becomes possible to quantify the true scale of climate finance required. This approach avoids conflating these costs with broader expenditures, ensuring that climate finance flows are tracked, reported, and allocated with greater precision. A clearer understanding of these incremental needs also enhances transparency and facilitates better planning for both donors and recipients, supporting more efficient and effective mobilization of resources to meet global climate goals.
Distinguishing climate finance from development finance allows for a clearer identification of additionality, ensuring that climate funds are directed toward their intended purpose and achieving maximum climate impact. By segregating these flows, stakeholders can ensure that climate resources are used optimally, leveraging them to address specific climate challenges such as mitigation, adaptation, loss and damage, and capacity building. A prime example of this is the recently negotiated $300 billion New Collective Quantified Goal,34 which represents a significant commitment by developed countries to mobilize annual climate finance for developing nations. This framework highlights the critical need to channel these funds toward targeted climate actions rather than diluting their impact by blending them with broader development efforts. Such precise allocation and accountability are essential for driving transformative climate outcomes and building trust among global partners.
Disentangling climate finance from development finance is more straightforward in some sectors and applications than in others. This depends on how precisely a comparable, purely development-focused counterfactual can be defined. For example, in power generation, different energy sources, investments, and projections are well documented, and switching to alternative generation technologies typically does not significantly alter the overall development impact. However, in sectors like transport, the counterfactual may involve a mix of approaches, such as substituting technologies, improving efficiency, or reducing demand, which can lead to differing development outcomes. Furthermore, in some areas—particularly certain types of adaptation efforts—separating the climate and development impacts can be particularly challenging due to their complex interdependencies.
Acknowledgements
The authors are grateful for the excellent support provided by Research Assistants: Pierre-Yves Colinet, Ruben Figueroa, and Linus Beer.
Recommended citation
Deep, Akash, Henry Lee, Wasim Tahir and Joshua Doyle. “The Green Swap: Disentangling Climate and Development Impact to Mobilize Climate Finance.” Belfer Center for Science and International Affairs, January 29, 2025
The Green Swap: Disentangling Climate and Development Impact to Mobilize Climate Finance
In this article
Footnotes
UN Office for Project Services, 2018, “Infrastructure Underpinning Sustainable Development."
International Energy Agency, 2024, World Energy Investment 2024.
International Energy Agency, 2024, Reducing the Cost of Capital.
“Mobilizing Capital Into Emerging Markets and Developing Economies," Bloomberg NEF, November 1, 2022.
International Energy Agency, 2024, World Energy Outlook 2024 Regions Dataset, October.
International Energy Agency, 2024, World Energy Outlook 2024 Regions Dataset, October.
Victoria Cuming, 2024, “Emerging Markets Energy Investment Outlook 2024,” Bloomberg NEF, November 14.
International Energy Agency, 2023, World Energy Outlook 2023, Executive Summary.
EIA’s International Energy Outlook, 2023: GDP per Capita, October 2023.
International Energy Agency, 2021, Financing Clean Energy Transitions in EMDEs.
World Bank, 2013, Financing Renewable Energy: Options for Developing Financing Instruments Using Public Funds. Washington, DC: World Bank.
Lion Hirth and Jan Christoph Steckel 2016 Environ. Res. Lett. 11 114010
Nat Bullard, 2024, Decarbonization: Stocks and flows, abundance and scarcity, net zero, January. (https://www.nathanielbullard.com/presentations)
The IEA estimated that lowering the cost of capital by 200 basis points could reduce the overall cost of the clean energy transition by USD 10 to 15 trillion by 2050, depending on the scenario considered. See: International Energy Agency, 2022, World Energy Outlook 2022.
International Energy Agency, 2021, Financing Clean Energy Transitions in EMDEs.
International Energy Agency, 2024, The role of development finance institutions in energy transitions.
Blended Finance Taskforce, 2023, Better Guarantees, Better Finance: Enhancing Risk Mitigation Tools for Climate Finance in Emerging Markets.
Climate Policy Initiative, 2024, Guarantees for Climate Finance: Unlocking Capital to Accelerate Climate Action.
International Energy Agency, 2024, The role of development finance institutions in energy transitions.
Deep and Morales, 2025, Disentangling climate and development impact: economic rationale and financial viability, unpublished manuscript, Harvard Kennedy School.
World Economic Forum, 2023, Scaling Voluntary Carbon Markets: A Playbook for Action.
Lam, et al 2025, Rewarding abatement benefits from climate projects: Learnings from carbon project transactions, Draft.
World Bank, 2015, Scaling up renewable geothermal energy in Indonesia: An integrated approach to evaluating a green finance investment. Washington, DC: World Bank Group.
Eventually, the average PPA tariff from these projects was set at 7.9 ¢/kWh. Though still significantly subsidized, the resulting present value of revenues collected rose to $651 million. The actual economic benefits, based the maximum willingness to pay for electricity as measured by the next best alternative, served as a proxy for the gross economic benefit of the electricity produced by the project over its full life. In present value terms, this was estimated to be about $1.4 billion.
Central Electricity Authority, 2023, Report on Optimal Generation Mix 2030, Government of India, Ministry of Power, April.
National Renewable Energy Laboratory, 2021, Levelized Cost of Energy and Levelized Cost of Storage – 2021 Annual Technology Baseline. Golden, CO: National Renewable Energy Laboratory.
Since the China-ETS was launched in July 2021, the average value was considered for the year 2022 only.
RMI, 2023, Financing Mechanisms to Accelerate a Managed Coal Power Phaseout, Boulder, CO: Rocky Mountain Institute.
Steele, P., 2015, Development finance and climate finance: Achieving zero poverty and zero emissions. IIED Discussion Paper. International Institute for Environment and Development, London.
Koch, S., & Aleksandrova, M., 2023, The future of climate and development finance: Balancing separate accounting with integrated policy responses (Policy Brief 19/2023). German Institute of Development and Sustainability (IDOS)
CARE International, 2023, Seeing Double: Decoding the Additionality of Climate Finance.
United Nations Framework Convention on Climate Change, 2024, COP29 UN Climate Conference Agrees to Triple Finance to Developing Countries, Protecting Lives and Livelihoods, November 24.
Deep, Akash, Henry Lee, Wasim Tahir and Joshua Doyle. “The Green Swap: Disentangling Climate and Development Impact to Mobilize Climate Finance.” Belfer Center for Science and International Affairs, January 29, 2025