
Abstract
There is growing recognition of the relative importance of anthropogenic emissions of methane as a contributor to global climate change. An important source of such emissions in some countries, including the United States, is the oil and gas (O&G) sector. This points to the importance of developing understanding of the marginal abatement cost functions for methane emissions reductions. Scholars have employed a diverse set of methodologies to estimate abatement costs, including engineering cost models, econometric analysis of natural gas markets, and statistical retrospective analysis of state-level regulation. We critically summarize these approaches and synthesize their results. We find significant potential for low-cost methane abatement in the O&G sector in the United States and elsewhere, although claims of widespread negative abatement cost opportunities should be taken with a grain of salt. We also find that the potential for low-cost abatement is not without limit. Whereas it appears that cutting methane emissions in half would be relatively inexpensive, a sharp uptick in marginal abatement cost may occur when reductions exceed 60 to 80 percent below baseline levels. This threshold may change over time with technological advances in remote sensing, which can reduce abatement costs at various levels of ambition.
1. Introduction
One hydrocarbon, methane (CH4), has received much less attention than the principal anthropogenic greenhouse gas (GHG) driving global climate change – carbon dioxide (CO2) – both in academic studies (IPCC 2023) and policy actions (United Nations 2015). This is largely because annual quantities of anthropogenic methane emissions are much less than those of CO2. Methane also has a relatively short atmospheric lifetime, on the order of twelve years, compared with the atmospheric half-life of CO2, which exceeds 100 years.
On the other hand, each molecule of methane has very high global warming potential (GWP) relative to CO2, being twenty-eight times greater over 100 years, and some eighty-four times greater if measured over a 20-year period. Historically, methane is responsible for about 30 percent of the global warming that has occurred since the beginning of the industrial revolution (International Energy Agency 2023).
Methane-emissions abatement can significantly reduce GHG concentrations, warming, and damages, particularly in the short term, which could help give the world time to “bend the curve” on CO2 emissions, conduct research on carbon removal, and, more generally, implement longer-term strategies to mitigate and adapt to climate change. Key sources of anthropogenic methane emissions include: oil and gas (O&G) extraction, transport, and refining; coal beds; landfills; and agriculture (livestock, as well as rice paddies).
The oil and gas sector is a major source of anthropogenic methane emissions in a number of countries, including the United States. Emission estimates for this sector come from government inventories, bottom-up detection and estimation under the U.S. Environmental Protection Agency’s (EPA’s) Greenhouse Gas Reporting Program, and estimates based on aerial and satellite remote-sensing technologies. U.S. EPA (2024a) estimated that U.S. O&G methane emissions represent nearly one-third of overall U.S. methane emissions, and about 3 percent of U.S. GHG emissions (based on a 100-year GWP). As discussed below, the U.S. EPA inventory may underestimate methane emissions (e.g., Alvarez et al. 2018). This sector may also provide opportunities for relatively low-cost emissions abatement.
Knowledge of the marginal costs of abating methane emissions is important for the development of the most efficacious and cost-effective government policies. First, such knowledge can help inform agencies in developing and implementing regulatory standards, such as EPA’s upstream O&G methane regulation (U.S. Environmental Protection Agency 2024c), by enabling effective targeting of emission-reduction strategies and technologies. Second, estimates can inform the anticipated response to emissions fees and taxes, such as the Methane Fee (literally, the “Waste Emissions Charge for Petroleum and Natural Gas Systems”) incorporated in the U.S. Inflation Reduction Act of 2022. Third, knowledge of marginal abatement costs could facilitate estimates of the potential emissions reductions that may be induced by subsidy policies (such as for plugging abandoned wells) and voluntary offset credit mechanisms. Finally, such estimates could inform the costs of complying with trade measures, such as a life-cycle methane emissions standard for liquified natural gas (LNG) exports to the European Union or other methane border adjustment mechanisms (Clausing et al. 2023).
Recent technological advances related to monitoring, measuring, and controlling methane emissions have enabled both private-sector efforts and public policies focused on methane emissions abatement. In this paper, we review and synthesize the academic and gray literatures on the costs of such emissions abatement in the O&G sector, with a focus on the United States.
2. Categories and Existing Estimates of Abatement Costs
We identify three methodological categories for estimating marginal abatement costs. One category is engineering cost estimates, with prominent examples including: the International Energy Agency’s (IEA’s) marginal abatement cost (MAC) curve for methane emissions from fossil fuel operations, covering new processes and equipment, leak detection and repair, vapor recovery units, replacement of leaky equipment, abatement ventilation, and coal mine methane utilization (International Energy Agency 2024); U.S. EPA’s Regulatory Impact Analysis (RIA) for the Supplemental Oil and Gas Sector Methane Regulation (U.S. Environmental Protection Agency 2022); ICF (2014, 2015, 2016) modeling of methane abatement opportunities; and energy-economic modeling (Delhotal 2006). Such engineering-based approaches can inform prospective analyses of proposed policies and actions.
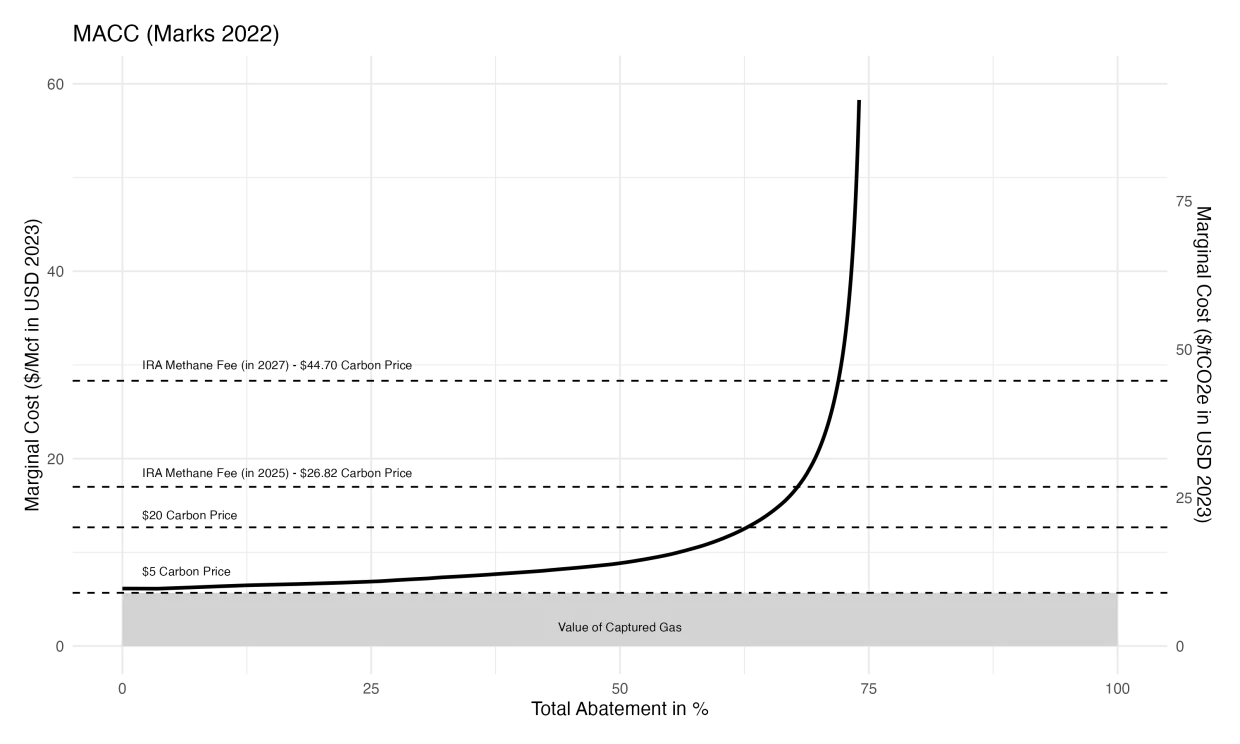
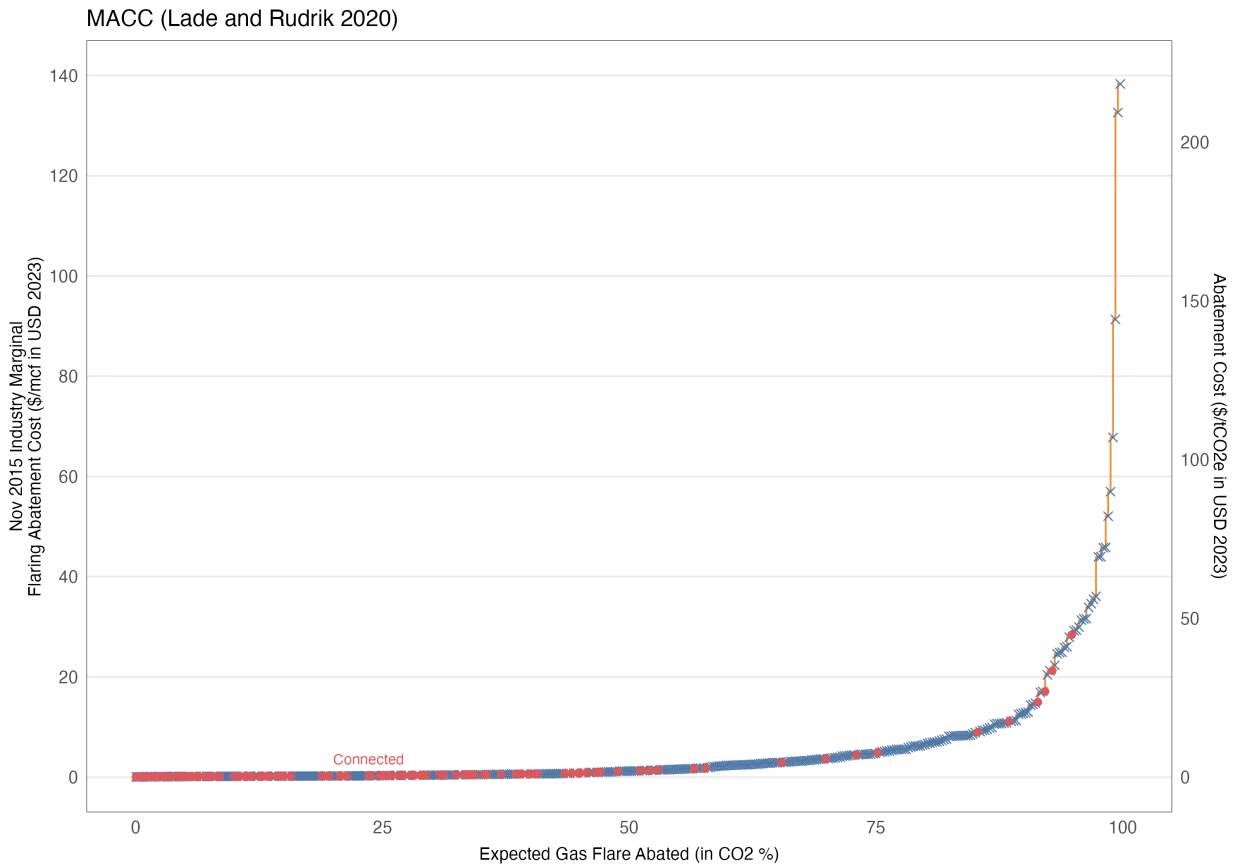
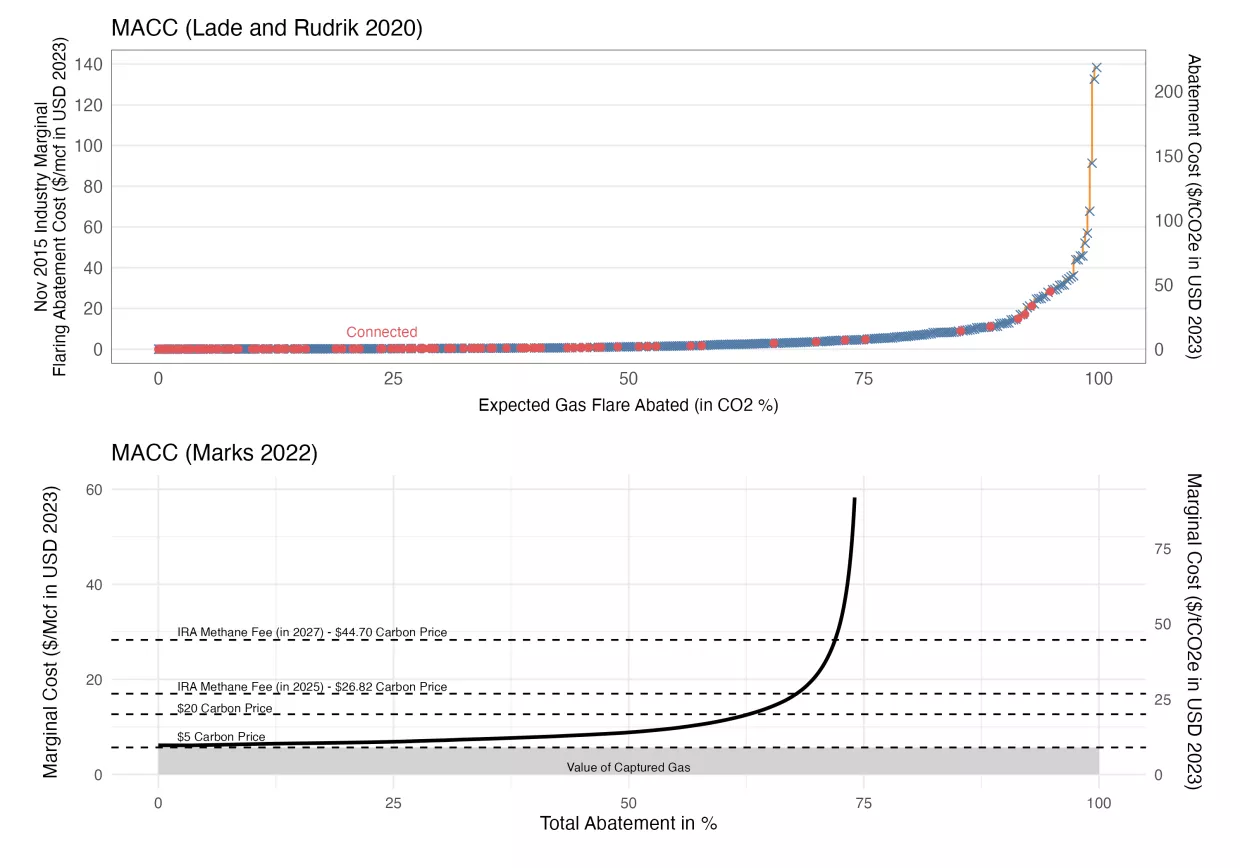
Retrospective analyses of markets and policies can produce estimates of abatement costs in practice. Hence, a second category of methane abatement cost estimates is econometrically estimated measures of costs. These are potentially important because engineering cost estimates may be incomplete, or may fail to fully reflect incentives among private firms to adopt, maintain, and use control technologies. There is an emerging literature that has exploited variation in natural gas prices (Marks 2022), as well as variation in regulations (Lade and Rudik 2020), to estimate abatement costs and emissions abatement associated with O&G extraction.
The third category of potentially useful methane abatement cost estimates consists of costs that may be revealed through implementation of public policies, including various policy instruments intended to reduce methane emissions (White House Office of Domestic Climate Policy 2021). In particular, implementation of subsidies and voluntary programs for methane reductions (U.S. Environmental Protection Agency 2024a), methane regulations (U.S. Environmental Protection Agency 2024c), and the methane fee in the Inflation Reduction Act of 2022 (U.S. Congressional Research Service 2022) could reveal upper bounds of costs of abatement. Such cost estimates can come directly from government or other analyses of these policies.
We carried out a comprehensive search within the above three categories for useful information about methane abatement costs. This search involved four approaches. First, we searched the relevant academic literature in key areas, including economics, political science, and law, as well as general climate change scholarship. Second, we searched for unpublished and other gray literature from the NGO community, private industry, governments, and multinational organizations. Third, we communicated with companies in the O&G sector, offset project developers, and NGO experts. Finally, we reviewed publicly available comments on EPA’s upstream O&G methane rule proposal and the methane fee implementation rule proposal.
In section 3 of the paper, we describe the results of our survey of the literature and other sources by providing brief descriptions of each of the available cost estimates, and summarize the key results. In section 4, we synthesize this information by scaling the available abatement cost functions so that they can be compared in a reasonable fashion. This enables us to portray three principal MAC functions in readily accessible form in common graphical presentations. We also examine the major reasons for the differences among the MAC functions. Finally, in section 5, we conclude with our key findings and their policy and research implications.
3. Abatement Cost Estimates
The costs of abating methane emissions at O&G extraction operations reflect the need to identify the source of emissions, invest in equipment, undertake process changes to reduce emissions, and train staff appropriately for the use and maintenance of new technology. A natural starting point for assessing the costs of various approaches for reducing methane emissions is then to build, from the bottom up, prospective estimates of the costs of these discrete actions. For an operator of an O&G drilling pad, learning the costs of specific interventions to reduce emissions is a natural starting point for how the operator responds to a regulatory performance standard or a methane fee.
A set of very different approaches to assessing the costs of reducing methane emissions is based on top-down, retrospective analysis, such as inferring abatement cost from econometric analysis of variations in natural gas prices and associated emissions responses. Related to this is inferring methane abatement from variations in regulation, gas flaring, and emissions.
3.1. Engineering Cost Estimates
Engineering cost models can identify and depict low-cost to high-cost technology and process options for reducing emissions for a representative operation – a so-called “model plant.” These approaches require knowledge regarding the baseline methane emissions from O&G production activities. For example, the IEA (2024) presents estimated emissions from O&G activities on a global, regional, and, to a limited extent, national basis. IEA constructs these estimates by using U.S.-based methane emissions estimates published in the U.S. EPA Greenhouse Gas Inventory, and produces U.S. emissions intensity measures by hydrocarbon (natural gas, oil), segment of industry (upstream, downstream), production type (onshore, offshore, unconventional, etc.), and emissions type (vented, flared, fugitive), which are then applied to other countries, with country-specific scaling adjustments.1
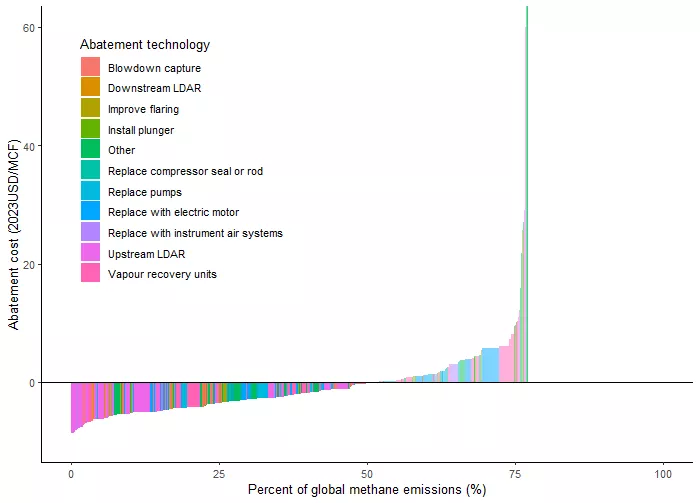
To evaluate the opportunities for reducing these estimated emissions, IEA examines 82 equipment-specific emission sources. They assess various abatement options – replacing equipment, routing captured emissions to a flare or storage tank, or employing leak detection strategies – in terms of their emission-abatement efficacy, capital costs, and operating costs. They produce region, hydrocarbon, and segment-specific abatement cost measures for these abatement options, reflecting the variation in both underlying emissions and technological costs. Many of these abatement cost options appear to be negative when accounting for the value of the captured methane which, in theory, can be sold into natural gas markets.
The net present value for an abatement option reflects the capital costs, operating costs, and revenues associated with selling captured methane at a country-specific well-head natural gas price, using an 8 percent discount rate. The abatement cost for this option then reflects the ratio of this present value to the expected quantity of methane emissions avoided, so in effect the benefit of the activity, that is, the methane emissions avoided, is not discounted.
The IEA arrays these O&G methane abatement options based on their estimated cost per ton through its Methane Tracker (converted into cost per thousand cubic feet, MCF, in Figure 1). IEA (2024) reports that the O&G sector produced about 77 million metric tons of methane in 2023. They posit that slightly more than half of this amount could be abated at no net cost, after accounting for the expected revenue from selling captured methane in gas markets. These cost estimates, however, do not account for the costs of detecting methane emission source in O&G infrastructure. Globally, the IEA analysis suggests that the O&G sector could reduce its emissions 74 percent by employing abatement options with net present value costs no greater than $10/tCO2e.2

The IEA Methane Tracker also provides detailed engineering cost estimates relevant to North America. The O&G sector in Canada and the United States emitted about 15.6 million metric tons of methane in 2023. IEA estimates that the O&G sector in these two countries could reduce methane emissions by about 25 percent at no net cost after accounting for incremental natural gas revenues (Figure 2). IEA posits that these sectors could cut their emissions 74 percent using abatement options that cost no more than $10/tCO2e on a present value basis. The net cost to the North American O&G sector, after accounting for revenues from selling captured methane from this 74 percent reduction, would be about $1.3 billion.

At the national level, Dunsky Climate & Energy Advisors (2023) catalogued 33 options for reducing methane emissions in the Canadian O&G industry in a report commissioned by the Environmental Defense Fund. In their analysis, they draw from an estimate of methane emissions for the O&G sector from the National Inventory Report. Given concerns that the inventory underestimates methane emissions, the authors inflate emissions by a factor of 1.7. This inflation results in an aggregate O&G methane emissions estimate for Canada that is consistent with the IEA’s estimate for this sector in Canada in the Methane Tracker Report (IEA 2023).
They attribute emissions to various types of facilities as a function of provincial-level inventory data, and examine how each of 33 identified emission reduction options would influence emissions across the facility types. They calculate the net present value of investment and operation, using a 5 percent discount rate, and then estimate the average cost per ton for this option by taking the ratio of this present value to the emissions abated over the option’s lifetime. Employing a lower discount rate than the IEA’s selected rate of 8 percent can result in lower net costs for abatement options that result in captured methane that can be sold into the gas market. For abatement options without potential for selling captured gas and for those with high maintenance or operating costs, the lower discount rate would increase the net costs of abatement options in comparison with the 8 percent rate.
Figure 3 illustrates the average cost of abatement in dollars per MCF for each of the 33 reduction options in Canada, arrayed from lowest to highest expenditure per ton of methane abated. There are options that have technology and operations costs that are less than the value of the methane captured and potentially sent to market as natural gas (see the negative cost options on the left side of Figure 3). O&G operators who can easily sell captured methane into the natural gas market (a point we return to below) could then more than pay for the emission abatement expenditures through the revenues from these sales. In Canada, Dunsky Climate & Energy Advisors estimate that O&G sector methane emissions could be reduced 80 percent with an average cost of $17/tCO2e. Note that the highest-cost option necessary to achieve the 80 percent reduction is more than $60/tCO2e (Figure 3 ).

The Dunsky Climate and Energy Advisors analysis relies on a number of emissions abatement measures drawing from a past ICF (2015) modelling analysis. Likewise, the estimated abatement costs in the IEA analysis draw from past U.S.-focused work by ICF (e.g., ICF 2014, 2016), and adjusted to reflect region-specific labor and energy market characteristics. Much of the engineering cost literature over the past decade depends, at least in part, on prior analyses undertaken by ICF. For example, Ocko et al. (2021) undertake a global assessment of methane abatement across all sectors of the economy. They estimate a “no net-cost” potential for O&G sector methane emissions reductions of at least 45 percent, reflecting the value of marketing captured gas. Their framework draws from published IEA analysis, which is based on collaborative work undertaken with ICF (see section 10.4.1 of IEA 2017).
Höglund-Isaksson et al. (2020) also undertake a global assessment of methane emission reductions. They find that about half of global energy sector methane emissions (which are dominated by O&G activities) could be eliminated at no net cost to firms. The supplementary information to their paper documents the sourcing of O&G abatement opportunities to ICF (2016) and U.S. EPA (2016a), which also relies on ICF (2014). Mayfield et al. (2017) evaluate the opportunities for reducing methane emissions in the U.S. transportation and storage sector, and estimate that about 70 percent of emissions could be realized with no net costs to firms when accounting for the marketing of recovered gas. Their model relies on a variety of EPA analyses and ICF (2014).
3.1.1. Concerns with Engineering Cost Estimates
There are serious concerns about the accuracy of bottom-up engineering cost estimates, which raise questions about the reliability of the abundant mass below the horizontal axis (negative costs) in Figures 1, 2, and 3. Engineering cost models rely on a number of assumptions that may lead to biased results. First, negative-cost technologies are premised on the assumption that the technology captures methane that can be sold into the natural gas market for a return that more than covers the technology cost. But this will not be an option for a drilling operator that is connected only to a crude oil pipeline. In other cases, there may be a nearby gas pipeline, but it could be fully subscribed, and thus the operator would not have an option to increase the quantity of natural gas it can send to market (Agerton et al. 2023; Elhai and Fronsdal 2024).
Second, some means of reducing leaks at an O&G operation may appear to be relatively low cost, but estimated costs typically do not include the costs of searching for and detecting leaks. Prior to the recent emergence of methane remote sensing data, the costs of monitoring methane emissions typically made such efforts cost-prohibitive. The rapidly changing monitoring and detection technology landscape for methane has dramatically lowered the costs of fixing leaks, including for so-called super-emitting events. As the costs of monitoring continues to fall, these leak interventions may become cheaper than assumed in some models. Engineering cost estimates customarily exclude the opportunity cost of the management time and attention that are required to bring about the emissions reductions.
Third, while upward-sloping cost functions can be produced though engineering-based analyses (such as Figure 1), they should not necessarily be interpreted to be a marginal cost function. Each discrete technology or process change represented by a specific rectangle is effectively the average cost for that intervention among the set of applicable O&G operators. In practice, some will realize lower costs and others will bear higher costs than what is implied by the cost for that given intervention (Jaffe and Stavins 1994).
3.1.2. Regulatory Compliance Cost Estimates
Despite the potential shortcomings of engineering costs models, they have been commonly used in projecting regulatory compliance costs for EPA Clean Air Act rules. In particular, EPA has relied on an engineering cost model to estimate the costs of its 2016 and 2023 rulemakings to reduce methane emissions from the O&G sector (U.S. EPA 2016b, 2024c).
In December 2023, EPA announced its final regulation of O&G sector methane emissions, and published the rule in the Federal Register in March 2024 (U.S. EPA 2024c).3 Over 2024-2038, EPA estimates that the regulatory efforts will reduce methane emissions from the sector by nearly 80 percent. While the agency also estimated reductions in volatile organic compounds and hazardous air pollutants, it only monetized the benefits of cutting methane emissions (U.S. EPA 2023).
In estimating the costs of reducing these emissions, EPA developed an engineering cost model that projected future O&G drilling and production activity over time, and identified components associated with each activity. The agency then applied estimates of various modifications to these components that would reduce methane emissions. This bottom-up, component-by-component analysis informed the construction of a “model plant” that aggregates compliance costs for a given O&G drilling pad or production facility.
The final rule imposed an array of obligations that would require changes in processes and investments for O&G producers. For new and existing sources, the rule requires (1) new monitoring of well sites, gathering and boosting stations, transmission and storage compressor stations, and natural gas processing plants; (2) zero-emissions pneumatic pumps and controllers; (3) limitations on emissions from reciprocating compressors and wet-seal centrifugal compressors; (4) zero emissions for liquids unloading activities; (5) controls on storage vessels; and (6) routing associated gas to sales lines (U.S. EPA 2023).
At the proposal stage, U.S. EPA (2022) estimated the costs of each of these required modifications of production components and activities in the proposal’s Regulatory Impact Analysis (RIA). Through the public comment period on the proposed rule-making, informed stakeholders provided feedback on the specific cost assumptions for many of these components.4
As a result, the RIA for EPA’s final rule (U.S. EPA 2023) reflected some modest changes from the RIA at the proposal stage (U.S. EPA 2022). EPA published methane emission reductions, gross compliance costs, the value of product recovery, and net compliance costs that account for the value of product recovery for both the New Source Performance Standards (NSPS) for new sources and the Emission Guidelines for state plans governing existing sources. Given the nature of an engineering cost model, as described above, EPA does not report the marginal cost of compliance for the rule. The available information, however, enables an average cost calculation.
For the period 2024-2038, EPA estimates that the O&G methane rule will deliver 23 million short tons of methane emissions reductions (590 MMTCO2e) under the NSPS, and 35 million short tons of methane emission reductions (890 MMTCO2e) under the Emission Guidelines. During this compliance time period, EPA projects $13 billion for the NSPS and $16 billion for the Emission Guidelines in present value gross compliance costs, discounted at 3% (U.S. EPA 2023). The value of recovered product offsets a considerable amount of the compliance costs, with $7.1 billion under the NSPS and $4.2 billion under the Emission Guidelines. The expected annual gross compliance costs for the NSPS and the Emission Guidelines would thus be on the order of $1.5 billion.
The average cost per tCO2e, after accounting for the value of recovered product, for the O&G methane NSPS is $9.83, while the Emission Guidelines average cost is $13.48/tCO2e. The two components of the rule-making yield an average cost of about $12/tCO2e to reduce emissions by about 80 percent.
3.2. Retrospective Cost Estimates
All of the prospective cost estimates above rest on assumptions about the technologies, their costs, their efficacy in cutting emissions, their adoption, their maintenance after adoption, as well as the broader economics informing the investment, production, and returns from upstream O&G development. Using two very different methodological approaches, retrospective analyses can provide some perspective on the cost and quantity of methane emission abatement at O&G operations. One does so by exploiting variation in natural gas prices, and the other by exploiting variation in state regulations.
3.2.1. Inferring Methane Abatement Cost from Variation in Natural Gas Prices and Emissions
First, Marks (2022) takes advantage of a reality emphasized in the engineering cost models – some control strategies to capture methane yield additions to a marketable commodity, natural gas. If the price of natural gas increases, then an O&G operator has a greater incentive to capture methane and sell it into the natural gas market. Over a six-year period, Marks exploits variation in wholesale natural gas prices at 96 local trading hubs (for example, where interstate pipelines intersect) across the United States. For each operator, Marks maps its gas production and methane emissions, the latter as reported through the U.S. Greenhouse Gas Reporting Program, to a local trading hub.5
The Marks analysis relies on the methane emissions reported through the U.S. Greenhouse Gas Reporting Program. Reported O&G methane emissions typically are not measured; they reflect an accounting of various activity types and technological equipment with their associated emissions. During the time period of his study, the Greenhouse Gas Reporting program yielded underestimates of emissions compared to direct measurements (Alvarez et al. 2018). This may reflect underestimation of fugitive emissions and super-emitting events, as acknowledged by Marks. Moreover, the program requires reporting only for operators with basin-wide annual emissions that exceed 25,000 metric tons of CO2 equivalent. Thus, it omits consideration of smaller operators, who may respond differently to changes in natural gas prices (and may be expected to face higher abatement costs). More broadly, for purposes of analytical tractability, Marks simplifies the operator’s decision making: the operator observes the current price and takes action accordingly. In practice, the operator’s decision is dynamic: the cost of abatement in each period would depend upon investments made in earlier periods and an operator would need to consider not just the current price but expectations of prices over the lifetime of the investment.
Marks employs panel regression analysis to examine how reported methane emissions vary with the price of natural gas. He finds that methane emissions fall in response to higher natural gas prices. The analysis does not examine how operators reduce their methane emissions, in contrast with the construction of an engineering cost model. In fact, Marks’s retrospective analysis does not need to identify how operators cut their emissions, because it posits that profit-maximizing operators search over all of their available options for capturing methane when natural gas prices increase. In this sense, it is more flexible than an engineering cost model, since it captures differences in costs of various abatement activities that can vary at the site level.
To produce a marginal abatement cost function, Marks takes the estimated statistical relationship between methane emissions and gas prices to simulate the response to a price on methane emissions. Such a methane price could reflect the shadow cost of a methane emissions regulation or a tax on methane, not unlike the methane fee established in the Inflation Reduction Act of 2022. Marks finds that a marginal price on methane of about $6.20/tCO2e would induce operators to reduce methane emissions by about 60 percent (Figure 4).6 After accounting for the value of selling methane as natural gas, Marks estimates that the net costs of responding to a $6.20/tCO2e price would be a little more than $60 million per year.

Figure 4 illustrates how the marginal abatement costs increase rapidly for higher levels of emission reductions. We have super-imposed the IRA methane fee levels, converted to dollars per thousand cubic feet (the units in Marks paper), onto the MAC function. This shows how the fee, in the absence of the regulation, would result in more than 70 percent emission reductions. The emission fee, however, would result in post-tax natural gas prices well beyond the range of natural gas prices used to estimate the statistical model. In practice, the true MAC function may be either more or less steep than what is revealed in the extrapolation to higher levels of abatement. Moreover, this presumes that firm behavior in response to a fee – which is known at a fixed level for years in advance – does not differ from firm behavior in response to a more volatile price of natural gas.
3.2.2. Inferring Methane Abatement Cost from Variation in Regulation, Flaring, and Emissions
As noted above, Marks excludes operations in North Dakota from his sample due to a potentially confounding change in regulations of natural gas flaring in North Dakota during his study period. Lade and Rudik (2020) focus on this flaring regulation, and thereby seek to illuminate the costs of a policy intervention targeting a specific activity resulting in methane emissions. They analyze the effects of the North Dakota flaring regulations through two approaches: first, by comparing flaring levels at wells before and after the regulations took effect in October 2014, while adjusting for economic conditions and gas capture infrastructure; and second, through a difference-in-differences approach, using wells in Montana (unaffected by North Dakota's flaring rules, and serving as the control group) as a baseline. Thereafter, the authors evaluate the policy's cost-effectiveness by creating MAC curves specific to each company, incorporating data on pipeline proximity to wells and using engineering cost assessments for the infrastructure of each well pad, which are then compiled to form both firm-level and industry-wide MAC curves. In effect, it is a hybrid strategy that uses engineering data to estimate abatement cost and a statistical program evaluation to estimate the quantity of abatement associated with the introduction of the North Dakota flaring regulation.
By including engineering cost estimates to characterize the costs and opportunities of connecting a given drilling operation to a natural gas pipeline, Lade and Rudik can illustrate the significant variation in opportunity costs associated with the regulation. Some operations are in close proximity (or may already have a piped connection) to a gas pipeline, while others would have to undertake an extensive investment in new piping to connect to a gas pipeline. This illustrates how an engineering cost-only model would mask such heterogeneity in costs among operators. This also enables Lade and Rudik to produce firm-specific MAC functions, so they can evaluate how more cost-effective policies – such as a methane fee – could lower the aggregate costs of methane emission reductions. The high degree of heterogeneity of emissions reductions costs across firms, identified by Lade and Rudik, underscores the benefits of market-based pollution control instruments relative to traditional command and control regulation.
In focusing on reducing methane emissions from flaring, Lade and Rudik’s work addresses an O&G drilling activity that is amenable to a very high-degree of methane abatement (potentially 100 percent in practice). They show how, at sufficiently high prices, operators could effectively eliminate methane emissions from natural gas flaring (Figure 5). The key issue is the opportunity to send captured gas to market. Beatty (2022) estimated a dynamic model of drilling and flaring decisions in Texas. She shows how pipeline construction by one firm may lower the costs to nearby competitors to connect to pipelines, which influences pipeline investment and, in turn, flaring abatement costs. She finds that a $9/tCO2e tax could reduce flaring by nearly 40 percent.7 Elhai and Fronsdal (2024) find that flaring responds to gas transport costs, and thus the marginal abatement cost for methane increases in areas subject to transport congestion.

4. Synthesis
A rich array of analytical frameworks – engineering cost models, econometric analysis of natural gas markets, and statistical retrospective analysis of state regulation – illustrate the potential for significant, low-cost methane abatement in the O&G sector. The engineering cost models used in the U.S. EPA, Dunsky Climate & Energy Advisors, and IEA analyses produce quite similar results for the United States and Canada. The U.S. EPA estimated that its 2023 rule would reduce O&G sector methane emissions by about 80 percent with an average cost of about $12/tCO2e. Dunsky Climate & Energy Advisors estimate an average cost of about $17/tCO2e for reducing Canadian O&G methane emissions by about 80 percent. The IEA estimates average costs of slightly more than $11/tCO2e for an 80 percent reduction in North American methane emissions from the O&G sector. To put these in context, modelling analyses of the Inflation Reduction Act of 2022 yield average abatement costs of $36/tCO2e to $87/tCO2e for reducing carbon dioxide emissions in the U.S. power sector (Bistline et al. 2023). Importantly, average costs over a large emission reduction may mask high marginal costs, which drive the impacts of a regulation or fee on natural gas prices. As illustrated in Figures 2 and 3, IEA and Dunsky Energy & Climate Advisors estimate that the marginal reduction activities necessary to reduce emissions at least 80 percent in North America cost more than $60/tCO2e to $100/tCO2e. Lade and Rudik’s firm-specific engineering cost curves demonstrate considerable heterogeneity across firms, with some having much higher-than-average costs for reducing emissions.
The Marks and Lade and Rudik analyses generate MAC curves for all methane emissions and flaring-related methane emissions, respectively, in O&G production. Figure 6 presents the two studies’ MAC functions on comparable scales. Both empirical functions reveal that cutting methane emissions in half would be relatively inexpensive, but a sharp uptick occurs in both functions, with methane abatement becoming significantly more expensive when abatement exceeds 60 percent of the baseline emissions in the Marks analysis,8 and when flaring emissions abatement exceeds 80 percent in the Lade and Rudik analysis. The average cost of reducing emissions 60 percent is about $6.10/tCO2e in the Marks analysis and $2.40/tCO2e in the Lade and Rudik analysis. Cutting emissions from flaring by 80 percent in the Lade and Rudik analysis would cost on average $6.75/tCO2e .

These retrospective analyses generate MAC functions that also provide important context for the prospective, engineering cost models. The Marks analysis finds that cutting methane emissions 60 percent would impose costs on the O&G sector, after accounting for the value of marketed natural gas captured through methane abatement strategies, of about $60 million per year. Thus, a cost-effective abatement strategy – such as a price placed on methane emissions – that delivers such a 60 percent reduction would realize three-quarters of the expected methane reductions under the U.S. EPA O&G methane regulation but for only three percent of the $1.5 billion annual net compliance cost projected for the EPA rule.
The IEA engineering cost model analysis also reveals sharply increasing abatement costs for North America at high levels of abatement. IEA finds that North America could cut methane emissions 74 percent at a cost of $1.3 billion, net of marketing captured methane, quite similar to the U.S. EPA estimate for an 80 percent reduction. IEA, however, finds that increasing methane abatement in North America from 74 to 80 percent – to reach the level projected under the U.S. EPA rule – would impose incremental net costs of $3.7 billion. For Canada in the Dunsky Climate & Energy Advisors’ analysis, raising abatement effort from 70 percent to 80 percent increases total abatement costs by more than two-thirds.
The retrospective analyses provide some evidence that the cost of reducing emissions at lower levels of ambition may be less expensive than suggested by the engineering cost models. For example, the Marks net compliance cost of $60 million for a 60 percent reduction in O&G methane emissions is about one-quarter of the net compliance costs for a 60 percent reduction in North American O&G methane emissions in the IEA engineering cost framework.
5. Findings and Implications
There is growing recognition of the relative importance of anthropogenic emissions of methane as a contributor to global climate change linked with elevated concentrations of greenhouse gases in the atmosphere. This has naturally heightened attention to methods of reducing methane emissions and to public policies and private programs that could incentivize or require the adoption and implementation of appropriate technologies at acceptable costs.
Some approaches to reducing methane emissions from a particularly important set of sources, namely wellheads, pipelines, and processing facilities in the O&G sector, can result in keeping more of a merchantable product – natural gas – in pipelines, and thereby sending more to market. The consequent incremental revenue can offset part or – in principal – all of the cost of abating emissions for certain sources, resulting in negative abatement costs. Of course, if negative abatement costs exist, the question naturally arises of why companies have not already repaired sites of leakage.
This reality raises the importance – and the subtlety – of developing understanding of the true marginal abatement cost (MAC) functions for methane emissions reductions. A diverse set of methodologies have been employed to come up with such cost estimates, including engineering cost models, econometric analysis of natural gas markets, and statistical retrospective analysis of regulation. These approaches, which we critically summarize and then seek to synthesize in this paper, point to two striking findings.
First, there appears to be significant potential for low-cost methane abatement in the O&G sector in the United States and elsewhere, although claims of widespread negative abatement cost opportunities should be taken with a grain of salt. This may change over time, however. As new satellite and other remote-sensing technologies become more available and reduce the costs of searching for and identifying the precise location of methane emissions, in more cases marginal abatement costs may indeed become negative, when measured net of the market value of conserved and marketed natural gas.
Second, in the short term at least, the potential for low-cost abatement is not without limit. Whereas it currently appears that cutting methane emissions in half would be relatively inexpensive, a sharp uptick in marginal abatement costs may occur when reductions exceed 60 to 80 percent below baseline levels. This threshold may also be affected significantly by technological advances in remote sensing which bring costs lower at various levels of ambition.
Such improvements in remote-sensing technologies – such as with the Tropospheric Monitoring Instrument (TROPOMI) on board the Copernicus Sentinel-5 Precursor satellite, launched in 2017, or the much newer MethaneSAT satellite, launched in 2024 – can also provide data which are geographically and temporally suitable for new and improved econometric estimation of the marginal abatement costs of reducing global methane emissions. Furthermore, such data can also be helpful for estimating methane abatement costs for sources outside of the O&G sector, namely coal beds; landfills; and agriculture (livestock, as well as rice paddies).
Acknowledgments
The authors are grateful for excellent research assistance by Bhavani K., Natalie Baker, and Alisha Shaparia, and valuable comments on a previous version of the manuscript by Lauren Beatty, Maureen Lackner, Gabe Lade, and Levi Marks. The Harvard Initiative on Reducing Global Methane Emissions – a Research Cluster of the Salata Institute for Climate and Sustainability at Harvard University – provided financial support for this research. The authors, who are responsible for all remaining errors, can be reached at: joseph_aldy@hks.harvard.edu, freinhardt@hbs.edu, and robert_stavins@harvard.edu.
Aldy, Joseph, Forest Reinhardt and Robert N. Stavins. “Methane Abatement Costs in the Oil and Gas Industry: Survey and Synthesis.” Belfer Center for Science and International Affairs, March 26, 2025
- A country with older equipment or weaker regulations, for example, would have emissions intensities scaled up from the U.S. metric. These emission intensities and country-specific activity data are used to generate country-specific emission quantities.
- The IEA data and related subsequent figures were originally denominated in 2023USD/MMBTU, which we converted to both $/MCF (the units in the Marks and Lade and Rudik figures below) and $/tCO2e. The latter enables direct comparison with the Canada engineering cost analysis (Dunsky Climate & Energy Advisors), the EPA RIA, and the Methane Fee.
- This rulemaking revised New Source Performance Standards covering emissions of methane and volatile organic compounds, and established emission guidelines to inform states as they develop and implement plans to limit methane emissions from existing O&G sources.
- For example, the American Petroleum Institute (2022) questioned EPA’s assumptions and capital cost estimates for zero-emissions pneumatic controllers, and supplied estimates that were nearly double the costs used for the EPA “model plant.” API (2022) also challenged the assumption in the EPA analysis that O&G companies will rely exclusively on third-party contractors for Optical Glass Imaging (OGI) monitoring. API suggested that cost estimates should account for the purchase of at least one OGI camera, which API estimate at about $100,000 per camera, for each operator. In other cases, stakeholders suggested modified implementation strategies that could lower compliance costs. For example, bp (2022) suggested a phase-in approach for pneumatic controllers requirements that would give operators the discretion to manage costs, emissions, and safety.
- Marks abstracts from the impacts of state-level O&G methane regulations by excluding data on O&G operations in Colorado and North Dakota. We return to this in the context of a North Dakota study in the next section.
- Marks (2022) reports a 60% emission reduction with a $5/tCO2e price in year-2016 dollars. In this paper, we have deflated all cost and price measures to 2023 dollars using the GDP implicit price deflator. Thus, we present in Figures 4 and 6 a 60% emission reduction at a price of $6.22/tCO2e in 2023 U.S. dollars.
- This converts Beatty’s $5/MCF tax in 2019 dollars into a tax per metric ton of carbon dioxide equivalent in 2023 dollars using the GDP implicit price deflator.
- As noted above, the Marks abatement cost function may reflect statistical fits that do not accurately characterize the out-of-sample abatement opportunities at prices outside the sample used.
References
Agerton, Mark, Gilbert, Ben, Upton Jr., Gregory B. 2023. The Economics of Natural Gas Flaring and Methane Emissions in US Shale: An Agenda for Research and Policy. Review of Environmental Economics and Policy 17(2): 251-273.
Alvarez, Ramón A., Daniel Zavala-Araiza, David R. Lyon, David T. Allen, Zachary R. Barkley, Adam R. Brandt, Kenneth J. Davis, et al. 2018. Assessment of methane emissions from the US oil and gas supply chain. Science 361: 186-188.
American Petroleum Institute. 2022. Public comments submitted on Docket ID EPA-HQ-OAR-2021-0317 Proposed Standards of Performance for New, Reconstructed, and Modified Sources and Emissions Guidelines for Existing Sources: Oil and Natural Gas Sector Climate Review. January 31, 2022, via www.regulations.gov.
Beatty, L. (2022). How Do Natural Gas Pipeline Networks Affect Emissions From Drilling and Flaring?. Working paper, University of Maryland, November 15, 2022 draft.
Bistline, J. E., Mehrotra, N. R., & Wolfram, C. 2023. Economic implications of the climate provisions of the inflation reduction act. Brookings Papers on Economic Activity 2023(1): 77-182.
bp. 2022. Public comments submitted on Docket ID EPA-HQ-OAR-2021-0317 Proposed Standards of Performance for New, Reconstructed, and Modified Sources and Emissions Guidelines for Existing Sources: Oil and Natural Gas Sector Climate Review. January 31, 2022, via www.regulations.gov.
Clausing, Kimberly A., Luis Garicano, and Catherine Wolfram. 2023. How an International Agreement on Methane Emissions Can Pave the Way for Enhanced Global Cooperation on Climate Change. Policy Brief 23-7. Washington, D.C.: Peterson Institute for International Economics, June.
Delhotal, K. Casey, et al. 2006. “Mitigation of Methane and Nitrous Oxide Emissions from Waste, Energy and Industry.” The Energy Journal, pp. 45-62.
Dunsky Energy & Climate Advisors. 2023. Canada’s Methane Abatement Opportunity. Report prepared for Environmental Defense Fund. https://www.edf.org/sites/default/files/2023-07/Canada%20Methane%20Abatement%20Opportunity.pdf.
Elhai, Coly, Fronsdal, Toren. 2024. Methane and Markets: Firm Incentives to Emit. Working paper, Harvard University, April 17, 2024 draft.
Höglund-Isaksson, L., Gómez-Sanabria, A., Klimont, Z., Rafaj, P., & Schöpp, W. (2020). Technical potentials and costs for reducing global anthropogenic methane emissions in the 2050 timeframe–results from the GAINS model. Environmental Research Communications, 2(2), 025004.
ICF. 2014. Economic Analysis of Methane Emission Reduction Opportunities in the US Onshore Oil and Natural Gas Industries. Fairfax, VA: ICF.
ICF. 2015. Economic Analysis of Methane Emission Reduction Opportunities in the US Onshore Oil and Natural Gas Industries. Fairfax, VA: ICF.
ICF. 2016. Summary of Methane Emission Reduction Opportunities across North American Oil and Natural Gas. Fairfax, VA: ICF.
Intergovernmental Panel on Climate Change (IPCC). 2023. Climate Change 2023: Synthesis Report. Contribution of Working Groups I, II and III to the Sixth Assessment Report of the Intergovernmental Panel on Climate Change, H. Lee and J. Romero, eds. Geneva, Switzerland: IPCC.
International Energy Agency. 2017. World Energy Outlook. Paris: IEA.
International Energy Agency. 2023. Global Methane Tracker. Paris: IEA. Accessed June 24, 2024, at Global Methane Tracker 2023 – Analysis - IEA.
International Energy Agency. 2024. Marginal abatement cost curve for methane emissions from fossil fuel operations, 2023. Updated March 2024. Paris: IEA.
Internal Revenue Service. n.d. Yearly Average Currency Exchange Rates. https://www.irs.gov/individuals/international-taxpayers/yearly-average-currency-exchange-rates, last accessed August 20, 2024.
Jaffe, Adam B., and Robert N. Stavins. 1994. “The Energy-Efficiency Gap What Does It Mean?” Energy Policy 22(10): 804-810.
Lade, Gabriel E., and Ivan Rudik. 2020. “Costs of Inefficient Regulation: Evidence from the Bakken.” Journal of Environmental Economics and Management 102: 1-19.
Marks, Levi. 2022. “The Abatement Cost of Methane Emissions from Natural Gas Production.” Journal of the Association of Environmental and Resource Economists, Volume 9, Number 2, pp. 165-198.
Mayfield, E. N., Robinson, A. L., & Cohon, J. L. 2017. System-wide and superemitter policy options for the abatement of methane emissions from the US natural gas system. Environmental science & technology, 51(9), 4772-4780
Ocko, I. B., Sun, T., Shindell, D., Oppenheimer, M., Hristov, A. N., Pacala, S. W., ... & Hamburg, S. P. 2021. Acting rapidly to deploy readily available methane mitigation measures by sector can immediately slow global warming. Environmental Research Letters, 16(5), 054042.
United Nations. 2015. Paris Agreement. New York: United Nations Framework Convention on Climate Change, November 29.
U.S. Congressional Research Service. 2022. Inflation Reduction Act Methane Emissions Charge: In Brief. Washington, D.C., August 29.
U.S. Energy Information Administration. n.d. Frequently Asked Questions. URL: https://www.eia.gov/tools/faqs/faq.php?id=45.
U.S. Environmental Protection Agency. 2016a. Control Techniques Guidelines for the Oil and Natural Gas Industry. EPA-453/B-16-001, October.
U.S. Environmental Protection Agency. 2016b. Regulatory Impact Analysis of the Final Oil and Natural Gas Sector: Emission Standards for New, Reconstructed, and Modified Sources. Research Triangle Park, North Carolina: Office of Air Quality Planning and Standards. EPA-452/R-16-002, May.
U.S. Environmental Protection Agency. 2022. Regulatory Impact Analysis of the Supplemental Proposal for the Standards of Performance for New, Reconstructed, and Modified Sources and Emissions Guidelines for Existing Sources: Oil and Natural Gas Sector Climate Review. Research Triangle Park, North Carolina: Office of Air Quality Planning and Standards, Health and Environmental Impacts Division. EPA-452/R-22-007, November.
U.S. Environmental Protection Agency. 2023. Regulatory Impact Analysis of the Supplemental Proposal for the Standards of Performance for New, Reconstructed, and Modified Sources and Emissions Guidelines for Existing Sources: Oil and Natural Gas Sector Climate Review. Research Triangle Park, North Carolina: Office of Air Quality Planning and Standards, Health and Environmental Impacts Division. EPA-452/R-23-013, December.
U.S. Environmental Protection Agency. 2024a. Inventory of U.S. Greenhouse Gas Emissions and Sinks: 1990-2022. U.S. Environmental Protection Agency, EPA 430-R-24-004. https://www.epa.gov/ghgemissions/inventory-us-greenhouse-gas-emissions-andsinks-1990-2022.
U.S. Environmental Protection Agency. 2024b. Landfill Methane Outreach Program (MOP). Washington, D.C.
U.S. Environmental Protection Agency. 2024c. Standards of Performance for New, Reconstructed, and Modified Sources and Emissions Guidelines for Existing Sources: Oil and Natural Gas Sector Climate Review. Federal Register (40 CFR Part 60), Vol. 89, No. 47, Rules and Regulations, March 8.
White House Office of Domestic Climate Policy. 2021. U.S. Methane Emissions Reduction Action Plan. Washington, D.C.