Workers install panels at a solar project May 21, 2025, in Galena, Alaska.
Introduction
Much of the North American Arctic remains dependent on fossil fuels, both for heating and electricity generation. Such dependence creates greater economic and energy insecurity, and increased health impacts for those relying on older, less efficient generators. In remote areas where the sun stays below the horizon for months in the winter, the idea of investing in solar energy that is intermittent and reliant on natural sources may seem counterintuitive. However, the findings in this paper indicate that the case for solar electricity in the Far North may be stronger than previously thought.
The populations in the Arctic regions of Canada, Alaska, Greenland, and parts of Russia are stable or declining. Over the last decade, electricity demand growth has been flat overall in these regions. There are two local exceptions: 1) where electricity is being used to supply a load formerly provided by direct fuel use, such as heating, and 2) where an additional load has emerged, such as a new mineral extraction project. Neither exception is common, although the latter will expand if demand for strategic minerals, such as rare earths, leads to new mining projects.
The marginal cost of power in most Arctic villages is the cost of diesel fuel. Each kilowatt hour (kWh, or kilowatt-hour of electricity) produced by a new solar facility is a kWh-e of power not generated by a diesel facility. If the annualized capital cost of the renewable generator, measured in cents per kWh, is less than the cost of diesel fuel that would otherwise be burned, then the solar system may be a good investment. The capital costs of an existing diesel facility are sunk—that is, consumers will still have to pay these costs whether the plant is used or not. For example, if a village invests in a solar system, the remaining capital costs of the diesel generator and its maintenance expenses will still have to be paid by consumers. Power from the diesel generator will be needed when it is not sunny, which comprises a significant part of the year in Alaska. The only cost savings from such an investment stem from the cost of the diesel oil that is not burned when the solar-generated electricity is consumed. If the total cost of the solar-generated electricity is greater than the cost of the diesel oil not burned, then communities should forego investing in solar generation. If the cost of the diesel oil is greater than the investment in solar, the investment in a solar photovoltaic (PV) system could be worth seriously exploring.
Several factors in the North American Arctic affect this calculation. Most villages in this region are not interconnected by either electric transmission systems or roads. Each village acts as a mini grid without access to economies of scale enjoyed by larger cities and towns. The absence of roads means that equipment and fuel must be delivered by sea or air. Delivering diesel fuel or sections of a renewable generator by barge can be expensive. In some instances, villages can only be accessed by airplanes, and therefore, the costs of transporting either diesel fuel or renewable systems can be extremely high. In remote villages, the cost of transportation can double the effective price of energy.
Unless villages can be reached by large ships, diesel supplies arrive once or twice per year, locking in the cost of the fuel for six months or more. For example, if oil is delivered in November at a certain price, the cost of diesel fuel in that community will not change until the next cargo arrives, which could be in May or June. When global oil prices are rapidly increasing, locking in the price can be beneficial, but when prices are falling, the opposite is true. Fluctuating fossil-fuel prices cause problems everywhere, but those are compounded for most Arctic villages by multi-month lock-in of periodic price peaks for what is generally their only option for electricity generation.
This paper looks at the potential for solar power in the North American Arctic, using northwest Alaska as a case study. Admittedly, the villages in this region vary considerably. Some are in boroughs that contain mining or oil and gas developments; these villages have sources of revenue that are not available to villages in other boroughs. Some villages border the coast and thus are vulnerable to sea level rise and land erosion, while others are inland with limited transportation access. Some towns are financially self-sufficient, while others must rely on financial assistance. There is no typical “village.” Villages in the Canadian Arctic, in Greenland, and in western Siberia differ in some ways from those in Alaska but share their isolation and dependence on diesel-fired generators.
Methodology
The metric for calculating the cost of a solar PV system is the levelized cost of energy (sLCOE). This metric divides the total cost of the energy system over its lifetime by the total energy produced over the same period.1 It combines capital costs (i.e., estimates of debt and equity), operation and maintenance (O&M), performance, and fuel costs. It does not include financing elements such as graduated discount rates, depreciation costs, and battery costs. (See the Department of Energy National Renewable Energy Laboratory2 for more information on sLCOE calculations.)
We have selected six villages for our analysis: Kivalina, Kotzebue, Deering, Selawik, Ambler, and Kobuk. They were selected because of:
Geographic location: The villages are all located in remote areas of Alaska and are dependent on diesel fuel for their electricity generation. However, due to their different locations, the costs of transporting both diesel and machinery to each of these villages varies, which allows for a sampled variety of costs across the region.
Availability of data: The data used in this paper are for imported stove oil from 2018 to 2023 used in generating electricity. Stove oil is a derivative of diesel, derived from crude oil with an anti-freeze additive. There is only a slight difference in BTU content between diesel and stove oil.3 The data used in our calculation was provided by the Northwest Arctic Borough.
Existing energy infrastructure: Unlike towns in the lower 48 states, these villages are not linked by a regional transmission grid. Instead, each village has its own isolated distribution system. Thus, significant efficiencies commonly available in a larger grid are unavailable to consumers in northwest Alaska.
Analytical Constraints
Data
As North Slope oil production dwindles, Alaska's state treasury faces decreasing revenue, forcing the state to cut its budget. These cuts affect university research and governmental data collection. Therefore, obtaining information on electricity costs, investments, and other energy-related data at the city or village level is challenging. Available data often vary with observations on the ground. During the 2021-2023 period, several locations observed prices as high as $9 per gallon,4 and in one case as high as $16 per gallon.5 Yet the official prices often were much lower. Finally, costs in one village may not be consistent with those collected in another. However, from discussions with people on the ground, we are confident that the numbers used in our calculations are reasonable.
Subsidies
The retail market for power in rural Alaska is influenced by a variety of subsidies. For instance, the Power Cost Equalization (PCE) program provides rural communities with relief from high electricity rates due to high diesel fuel costs.6 Administered by the Alaska Energy Authority, the program seeks to equalize electricity costs in rural Alaska with those in urban areas by providing a per kWh subsidy on electricity rates.
In Nome, the PCE program subsidizes the local electricity rate, reducing the cost per kWh. This allows Nome residents to pay electricity costs more comparable to those in the relatively urban parts of the state. The PCE program has a substantial impact: 2020 estimates show that in some communities it lowers residential prices by nearly 50%. As a result, consumers in rural Alaska do not pay the actual cost of power.
Alaska has also implemented a subsidy program to stimulate the deployment of renewable energy. The Alaska Renewable Energy Fund, established in 2008, encourages investment in renewable generation, but most of the $317 million in state expenditures from this fund has been used to develop hydropower and wind generation. It was not until 2023 that the fund was committed in perpetuity—as a permanent component of Alaska’s energy infrastructure policy.7 As a result, it does not provide a reliable representation of solar generation costs, nor can it provide year-on-year data trends. Consequently, we have created hypothetical solar cost profiles, using data from the National Renewable Energy Laboratory (NREL) plus rough estimates of transport and operation costs.
As mentioned earlier, the capital costs of existing diesel generators are sunk and must be paid regardless of how often the asset is used. Any new solar capacity reduces the amount of diesel fuel consumed. An analysis of the economic viability of solar investment compares the cost of power from a renewable facility to the cost of the diesel oil not consumed. For instance, if a solar farm was built to serve a village but only produced power for an average of six hours per day for seven months, the comparison would be the total cost of generating the solar power compared with the cost of the diesel oil not consumed in that seven-month period.
For example, if 100% of the electricity in a hypothetical community was supplied by diesel generators, the consumers would pay for the capital costs of the generators as well as the costs of fueling and maintaining them. If the community chooses to invest in solar energy, the existing electric generator will not disappear. It would still supply much of the community’s electricity. The consumers would still have to pay for the capital costs of the electric generator because no configuration of solar systems—even with batteries—can meet more than a portion of the region’s electricity demand due to the number of hours without sunlight. Solar energy can only save a portion of the annual consumption of diesel oil. The question is whether the amount saved would justify the solar facility.
What if a village had no electricity and was starting from scratch, but intended to meet a portion of its demand with solar energy? Would this scenario significantly change the economics? No, the village would still have to invest in diesel generators to back up the solar (or wind) system. Even with battery storage, solar-generated electricity would not be sufficient to meet demand 24/7. Solar investments do not eliminate the need for diesel generators; they only reduce the amount of electricity needed from those generators and thus the amount of diesel oil that the generator uses. In summary, for solar-powered electricity to be economic in northwest Alaska, it must be cheaper than the diesel oil consumption foregone.
Findings
Diesel
Table 1 presents the average diesel prices for six communities in northwest Alaska from 2018 to late 2023, as reported by the Northwest Arctic Borough.
What is striking about these numbers is that they differ substantially from one community to another and from one year to another.
Unlike using a pipeline or an electric transmission line, where the cost of transport is predictable and regulated, the cost of transporting oil products in Alaska is market-driven and often set by negotiations with the barge or plane owner. As mentioned earlier, these costs can differ from week to week, depending on availability and weather. In 2022 and 2023, the cost of generating electricity from diesel increased, driven by the global increase in petroleum prices. Although these elevated prices may prove to be transitory, they demonstrate the volatility of fossil fuels.
Due to these and other factors, electricity generated by diesel generators at unsubsidized wholesale prices is estimated to cost more than double the 2022 U.S. national average wholesale price of $0.11/kWh.8 In locations such as Kobuk and Ambler, the difference can be five to six times higher. It is important to remember that the prices that consumers see are the subsidized prices, not the actual prices. Further, smaller generation systems can be more expensive to run than larger systems on a cost per kilowatt basis because they are often much less efficient.
The cost of the diesel fuel burned per kWh-e generated is calculated by dividing the cost of diesel fuel ($/gallon) by the fuel efficiency of the generator, measured in kWh-e per gallon:
The diesel costs in our calculations are from Table 1. The generator fuel efficiencies, acquired from the Northwest Arctic Borough Community Profiles, are shown in Table 3, below. Table 3 also shows the generator efficiencies expressed as a percentage, calculated by dividing the fuel efficiency in kWh-e by the thermal energy content of diesel fuel. Distillate Oil No. 1 contains 139,000 Btu/gal, while Distillate Oil Diesel contains 137,381 Btu/gal.9 Given that the difference is about 1%, we use 139,000 Btu/gal in our calculations. This yields a thermal energy equivalent of 139,000 Btu/gal / 3412 Btu/kWh-t = 40.74 kWh-t/gal, where kWh-t describes thermal kilowatt-hours.
The fuel efficiencies in Table 2 may be overestimates, since many village diesel generators are getting older and may no longer be operating at optimal efficiencies as recorded for the Northwest Arctic Borough. The magnitude of this effect is impossible to estimate with available data. Notwithstanding, the equation above demonstrates that fuel costs per kWh are very sensitive to changes in generation efficiency.
Table 2 Fuel efficiency values in selected villages. Source: Northwest Arctic Borough Community Profiles, 2024
Village
Fuel Efficiency (kWh/gallon diesel)
Generator Efficiency (%)
Kivalina
14.42
35.396
Kotzebue
14.78
36.280
Deering
12.18
29.898
Selawik
13.85
33.997
Ambler
12.66
31.076
Kobuk
13.49
33.114
Table 3 shows the fuel costs for electricity generation from diesel in our selected villages, calculated as described. These are conservative estimates, and it is probable that actual generator efficiencies are lower due to degradation over time.
Table 3. Fuel cost of electricity generated by diesel in selected villages. Source: Authors' calculation
Village
Fuel Efficiency (kWh/gallon diesel)
2018 Electricity Fuel Cost (¢/kWh-e)
2019 Electricity Fuel Cost (¢/kWh-e)
2020 Electricity Fuel Cost (¢/kWh-e)
2021 Electricity Fuel Cost (¢/kWh-e)
2022 Electricity Fuel Cost (¢/kWh-e)
2023 Electricity Fuel Cost (¢/kWh-e)
Kivalina
14.42
31.1373
31.4147
28.5714
29.1262
31.6227
42.6491
Kotzebue
14.78
40.3924
40.3924
40.0541
39.7158
54.1272
61.7050
Deering
12.18
40.2299
27.5041
33.8259
33.8259
38.1773
48.6043
Selawik
13.85
57.6895
45.9206
45.9206
45.9206
55.7401
55.7401
Ambler
12.66
77.0142
75.2765
81.3586
81.3586
113.9021
144.8657
Kobuk
13.49
72.2758
68.7176
68.7176
68.7176
80.2076
114.5293
Solar
Solar energy development in the Arctic faces unique challenges due to extreme seasonal variations in daylight hours, limited solar insolation, and harsh weather conditions. Alaska's high latitude results in extreme variations in the number of daylight hours throughout the year. During the winter months, the region experiences limited sunlight, with some areas experiencing complete darkness for several weeks. Conversely, in summer months, there are extended periods of daylight, which provide abundant solar energy. Thus, solar systems can produce substantial electricity in the summer months and negligible amounts during mid- winter.
The harsh weather conditions in Alaska, including extreme cold, snow, and ice, also pose challenges for solar panel installation, operation, and maintenance. Snow and ice accumulation on panels can reduce their efficiency while extreme cold can impact their performance. The remote and isolated nature of many communities complicates the transportation and installation of solar panels and associated equipment; the absence of existing renewable energy infrastructure amplifies these difficulties. The expected monthly solar output and the seasonal load profiles of communities can differ substantially across the state. As mentioned earlier, our analysis presumes that a kilowatt-hour produced from renewable sources displaces a kilowatt-hour that would otherwise be generated by stove oil.
The LCOE calculation for the cost of solar generation included:
Solar irradiance: This is the fundamental driver of a solar panel’s energy output, determined by geographical location, time of year, and time of day. PVWatts is a calculator developed by NREL for estimating the energy production and cost savings of grid-connected solar PV systems. By providing information about a specific location, system size, and other parameters, users can analyze the expected performance of a solar PV system. See Appendix 1 for additional information about PVWatts.
PVWatts uses solar radiation and weather data, along with user inputs, to model the energy output of a PV system over time. It considers factors such as solar panel efficiency, system losses, and local weather conditions to provide an estimate of the system's energy production. As one would expect, the amount of power produced during the four months from November through February is negligible. Interestingly, the highest insolation rates in northwest Alaska are in April (over six hours per day), as June and July are traditionally cloudier.
Inputting the system size and using the default assumptions offered by PVWatts, for each month of the year for each village, we calculate the annual energy production from a 1.35 MW solar farm in each village based on location-specific solar irradiation and geographic parameters. This value determines the power generating ability of a system over the course of its lifetime to determine the sLCOE for solar.
Table 4. Annual energy production from a 1.35 MW solar farm for selected villages. Source: Calculated using PVWatts, National Renewable Energy Laboratory, 2023
Village
Annual Energy Production (kWh/Year)
Kivalina
1,033,711
Kotzebue
1,108,042
Deering
1,108,042
Selawik
1,172,877
Ambler
1,024,919
Kobuk
1,024,919
Installation costs: These include the cost of solar panels, inverters, mounting systems, and other equipment, as well as costs for site preparation, permitting, and interconnection. For a utility-scale system (500 kW or greater in size), the University of Alaska Fairbanks’ A Solar Design Manual for Alaska estimates a cost of about $2.00/W for materials and installation for locations on the Railbelt, a broad geographical area serviced by the Alaska Railroad, encompassing Alaska’s most populous areas.10 An average quote of $2.31/W was provided as an approximate installation cost in our selected villages.11 Each village is approximately 600 miles away from the Railbelt. The difference between these costs can be attributed to variance across villages, reflecting procurement, transportation, and installation challenges. The installation cost of a larger (3 MW) community solar system in the lower 48 states would be between $1.49/W to $1.76/W (in 2023).12
Operation and maintenance (O&M) costs: These costs include expenses for maintaining and monitoring the solar-powered system, such as cleaning, inspections, and component replacement. O&M in Alaska must include snow clearing, especially in northwest Alaska where there are high winds and substantial variability in temperature.13 The most recent O&M estimate, from 2017,14 is between $50/kW/year to $100/kW/year depending on the remoteness of the village. In the lower 48 states, the O&M cost of a similarly sized solar system is approximately $40/kW/year.15 Unlike the lower 48, O&M in Alaska is not directly proportional to system size. Rather, it is dependent on the availability of trained workers with expertise in maintaining electrical equipment. In addition to fuel costs and travel costs, one-time contracting costs will also inflate O&M costs. Given that our selected villages are remote (as assessed by their small populations and relative distance from the Railbelt), we assume a O&M cost of $75/kW/year.
Discount rate: The discount rate converts future costs and benefits to their present value. Costs and benefits occurring in the future are worth less than those occurring today. The choice of discount rate can significantly impact the LCOE calculation. NREL uses a 7% discount rate to evaluate solar PV systems.15 One might argue that 7% is too high, since the capital costs for solar installations have often been borne by governments rather than the private sector. The borrowing rate for state governments is now close to 6% and for the federal government, it is approximately 4.4% (June 2025). In this analysis, we use a discount rate of 5.8%, recognizing that this number will fluctuate over time.
Incentives and subsidies: Government incentives and subsidies, such as tax credits, rebates, and feed-in tariffs, can lower the effective cost of solar energy systems. In our initial analysis, we attempt to not apply subsidies, but in Alaska, they are often marbled into the data stream and difficult to filter out.
In our analysis, summarized in Table 3, we use three estimates for solar PV costs: 1) a typical or base estimate, 2) a low-cost estimate, and 3) a high-cost estimate. We compare these estimates to diesel prices for 2018-2023. This forms our ‘base case’. The low case represents a cost that is 20% lower than the base case, representing steep price declines in costs for purchasing and installing solar PV systems. The high case is represented by a 20% increase from the base case, illustrating more challenging situations such as an increase in the costs of transporting, installing and maintaining solar PV systems.
Through the years, the cost of generating electricity from diesel has risen, primarily driven by increases in the cost of fuel, which in some villages reached levels over $10 per gallon in late 2023. Given historical fluctuations in global oil markets, diesel prices could rise and fall substantially from one year to the next. As discussed earlier, solar generation is more expensive in rural Alaska than in other parts of the United States due to higher transport, installation, and O&M costs. Notwithstanding, the capital costs of new solar systems continue to fall.
In Table 5, our analysis shows that in 2023 solar was cost-effective in four out of the six villages studied—Kotzebue, Selawik, Ambler, and Kobuk—even under base or high-cost scenarios. However, in Kivalina and Deering, solar generation remains more expensive than diesel, especially in the base and high-cost estimates. In these two communities, diesel fuel costs are lower due to better access or efficiency, making diesel the more economical option under current assumptions.
Our estimates may be biased against solar due to the potentially high efficiency numbers for diesel generators we employ. Furthermore, we ignore the health externalities from exposure to air pollution, which can be particularly acute in some Alaskan villages. Crude oil price fluctuations would further impact this price comparison. For example, if oil prices drop to 2021 levels, generating electricity with diesel would be less expensive in Kotzebue, Deering, and Kivalina. On the other hand, if they remain at 2023 levels, solar generation would be cost effective in five of the six communities. The cost of diesel oil will remain volatile and, thus, the cost of oil generated electricity will fluctuate significantly from one year to the next. On the other hand, the cost of electricity from a solar system will be a function of its initial capital costs and will not change over time. If one believes that world oil prices will decrease into the range of $50 per barrel and stay there for the next decade, then solar is a much less attractive option for northwest Alaska. If one believes that that oil prices will fluctuate from $50 to around $100 per barrel then investing in solar energy is an option worth considering.
Table 5. Cost of electricity by existing diesel versus solar. Source: Authors' calculation
Village
Electricity Fuel Cost from Diesel (¢/kWh-e)
Electricity Fuel Cost from Solar (¢/kWh-e)
2021
2022
2023 (August)
2023 Low Case
2023 Base Case
2023 High Case
Kivalina
29.1262
31.6227
42.6491
41.73
52.17
62.60
Kotzebue
39.7158
54.1272
61.7050
38.93
48.67
58.40
Deering
33.8259
38.1773
48.6043
38.93
48.67
58.40
Selawik
45.9206
55.7401
55.7401
36.78
45.98
55.17
Ambler
81.3586
113.9021
144.8657
42.09
52.61
63.14
Kobuk
68.7176
80.2076
114.5293
42.09
52.61
63.14
As outlined in the rationale above, we use a discount rate of 5.8% and a project lifetime of 25 years. If one assumes that discount rates will be lower, the relative advantage of substituting solar power for diesel-fueled generation improves. The opposite is the case if discount rates increase. The private discount rate will reflect the cost of equity, which in Alaska will be greater than 10%. If solar systems have no subsidies and must be funded only by private equity (i.e., no debt available), then the cost of solar becomes less competitive. This outcome would be true for almost any fossil-fueled generation.
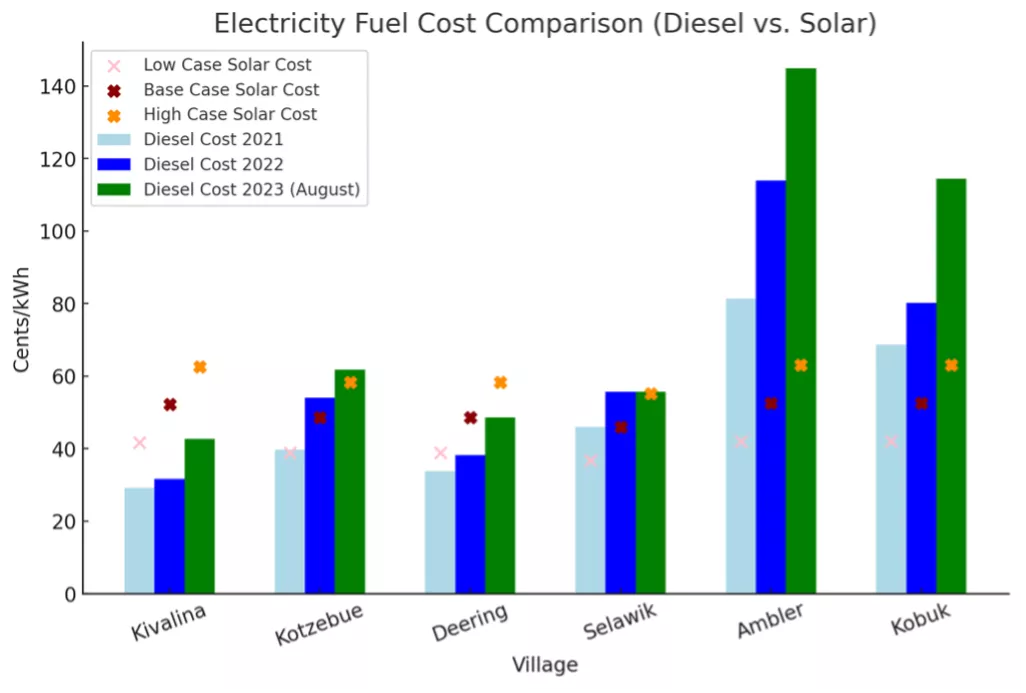
Figure 1. sLCOE of electricity cost by diesel versus solar energy for selected villages across years.
As shown in Figure 1, in places like Ambler and Kobuk where diesel costs are high, solar can be a viable alternative by a significant margin. The high cost of diesel in these places can be partially attributed to high non-fuel expenses (~35% higher than in Kotzebue) as a result of distance from ports and small populations. Smaller populations tend to either have to transport smaller quantities of fuel at one time, making each trip more expensive, or buy in bulk and bear additional storage costs and price fluctuations at the time of purchase. Kivalina also has very high non-fuel expenses (56% higher than Kotzebue), but its proximity to ports allows for relatively cheap diesel prices (in recent years, cheaper than Kotzebue). As a result, in Kivalina, diesel generation remains more economical than solar generation.
What Might Change These Numbers?
There are four factors that might alter these numbers, each of which favors renewable energy.
Carbon Taxes
Carbon pricing initiatives are currently in force in 55 national jurisdictions across the globe, with an additional 44 in subnational jurisdictions.17 Hafstead and Picciano at Resources for the Future calculate that a $40 per ton tax would increase diesel prices by approximately $0.40 per gallon.18 By itself, a $40 per ton carbon tax would significantly improve the cost competitiveness of solar energy. That said, as of 2025, the likelihood of a carbon tax or a cap-and-trade program being enacted by Congress in the next few years remains slim.
Advanced Capacity to Store Electricity
A technological breakthrough that would have a positive impact for small Arctic villages unconnected to transmission networks would be cost-competitive electricity storage and, specifically, mid- and long-term battery storage. Battery systems that would allow residences to store two to three days of power at a competitive price would dramatically expand the number of kilowatts that could be harvested from a solar system, particularly in the shoulder months of May and August. They would also allow villages to build larger solar systems, thereby taking advantage of economies of scale and reducing the cost per kWh of the power produced. Accessibility remains a key question. In 2021, NREL projected shorter term (4-5 hours) battery storage prices to reach $208 per kWh by 2030 and $156 by 2050.19 Recent projections in 202520 show that battery prices have already slipped below the $200 per kWh goal. While shorter-term storage has advantages, the overall benefits are limited.
Storage for periods of time measured in days as opposed to hours would provide significant benefits, but such technologies are not yet available at commercially competitive prices and are unlikely to be so prior to 2030.21 While longer and more cost-effective storage would increase the kilowatt-hours of available solar-generated electricity while reducing the number of hours that diesel generators would have to operate, there are several caveats. First, batteries transported to northwest Alaska will be much more expensive than in the lower 48 states. The more batteries that are installed, the more hours that solar can be used, but also the more expensive the storage costs. Under these conditions, the cost advantage of solar generation is so narrow that batteries might shift our cost comparison to favor diesel facilities. That said, as battery technologies and costs improve, this situation may change. Secondly, even if today’s batteries were cost-effective, diesel generation will be needed to provide electricity for 20-30% of the day. As we have said repeatedly, solar power by itself does not replace the need for some diesel generation; it only reduces the overall quantity of diesel oil that must be burned.
Greater Focus on the Health Impacts of Burning Diesel
Diesel oil contains more than 40 toxic air contaminants and increases the risk of respiratory illnesses, heart and lung disease, and cancer.22 Residents of northwest Alaska are known to be more vulnerable to respiratory diseases, such as asthma, and such diseases exhibit higher rates among Native children.23,24Alaskan communities have some of the highest rates of respiratory morbidity documented for any Native population – susceptibility to which is heightened by exposure to diesel exhaust - is five times higher in Alaska Native children than the general U.S. population.
The combustion of diesel oil in generators that cannot meet federal air standards is a major contributor to these health problems. In 2020, Congress exempted Alaska from EPA Tier 4 restrictions on particulate emissions from diesel generators, locking in emission levels that exceed national standards, to allow villages to avoid purchasing more expensive equipment and paying higher maintenance costs.
While the actual costs of air pollutants for Alaska's villages require additional analysis beyond this paper's scope, exposure to these pollutants raises the local cost of burning diesel oil. That is, the village population pays for both the diesel fuel and the health costs of breathing the exhaust from burning that fuel. The result is that investment in renewable generators that emit no particulates or other toxic air contaminants provides even greater benefits than a simple kWh comparison would indicate.
Uncertain Subsidies for Clean Power
As discussed earlier, the largest subsidy in Alaska has been the PCE program, which reduces the actual price of electricity generated from diesel-fueled facilities. This subsidy is an implicit disincentive to invest in renewable power. It is unlikely to be removed, since it enables poorer Alaskans to access affordable electricity, but perhaps it might be amended to work in tandem with subsidies to help accelerate the deployment of renewables and, eventually, storage.
In 2021 and 2022, Congress passed additional subsidy programs to accelerate the deployment of clean energy. These programs (including the Renewable Energy Production Tax Credit [PTC], the Investment Tax Credit [ITC], and the Clean Renewable Energy Bonds [CREB]) have the potential to reduce the capital costs of both wind and solar generators. Tax credits in the Inflation Reduction Act (IRA) would have had a large impact on the relative economics of solar energy across the United States, including the Arctic regions of Alaska.
However, the Trump administration and the U.S. Congress oppose the continued funding of many subsidies and tax credits under the IRA. With the passage of recent legislation, most of the renewable electricity tax credits will be phased out over the next two years.25 Future administrations may reverse these actions and pass new subsidies that would enhance the relative economics of solar energy advantage, but over the next three years, renewable energy alternatives are unlikely to receive measurable federal subsidies.
Conclusion
Diesel fuel prices have historically been volatile, fluctuating from one year to another. More importantly for Alaska, the expense of transporting fuel, particularly for Arctic villages that are not directly on the coast, adds a very high-cost premium. To an extent, dependence on diesel oil creates an inherent financial security problem for both the state and villages. Neither has any control over oil price fluctuations, which can affect both state and local budgets. An advantage of renewables is that most of their costs are upfront; thus, there is no cost uncertainty once the system is operational, and the impact on budgets becomes predictable. There is a clear security advantage for renewable investments.
As shown in our analysis, solar-powered systems are currently economical options in many parts of rural Alaska, with some regions enjoying greater benefits than others. Alaska subsidizes diesel fuel, and the total cost of these subsidies in 2019 was over $29.6 million. We attempted to filter out these subsidies, but we may not have succeeded in every case. Further, we did not account for the carbon and air pollution externalities that should be added to these prices. If storage options continue to advance and costs come down, the option of renewables plus storage could be a boon to Arctic communities.
The notion of building solar-powered systems in the Arctic regions of Alaska seems counter-intuitive given the long dark winters and the extreme cold. However, energy markets are changing, the costs of these systems are declining, and the total costs of relying on diesel generators are becoming better understood and remain high. Further, the public is becoming more aware of the impacts of burning diesel fuel on public health. There is a clear trend towards greater use of solar energy, and, if coupled with less expensive storage, this trend is likely to accelerate over the next ten years, even in the coldest and most remote areas of Alaska.
Appendix 1: PVWatts Tool
PVWatts is a web application developed by the National Renewable Energy Laboratory (NREL) that estimates the electricity production of a grid-connected, roof- or ground-mounted photovoltaic system based on a few simple inputs. To use the calculator, information about the system's location and basic design parameters is inputted manually by the user. PVWatts then calculates estimates of the system's annual and monthly electricity production. PVWatts uses a set of assumptions that are appropriate for flat-plate photovoltaic systems with crystalline silicon or thin film modules. PVWatts results are not appropriate for systems using concentrating collectors, or for modules using novel cell technologies or module designs.
The kilowatt-hour per year (kWh/year) value that appears at the top of the “Results” page (as seen in Figure 1) and the monthly values in the table are sums of the hourly output values over those periods. PVWatts calculates these values using long-term typical year solar resource data. These results do not represent the quantity of electricity that a system generates in a particular year. Instead, they represent the typical electric production expected over a given period. In general, you can expect the system's total electrical output for a given month of a particular year to vary by as much as ±30% from the long-term typical value. Similarly, the total annual output for a particular year may vary from the long-term typical value by as much as ±10%. For the purpose of this analysis, we assume that this value represents the typical system annual output.
We would like to thank the Arctic Initiative for its support of this project. We would especially like to thank Yanchao Li, Rachel Mural, and Liz Hanlon. Several individuals provided substantial guidance, information, and support in the development of this paper, including Jenny Kwon, Ingemar Mathiasson, Fran Ulmer, and John Holdren. While we benefitted tremendously from their suggestions, the authors take full responsibility for the findings and conclusions of the research.
Recommended citation
Lee, Henry and Windy Dewi. “Solar Energy in the Arctic: A Case Study of Northwest Alaska.” Belfer Center for Science and International Affairs, September 14, 2025
Solar Energy in the Arctic: A Case Study of Northwest Alaska
In this article
Footnotes
Pérez-Linkenheil, C., Telsnig, T., Viebahn, P., & Löffler, K. (2019). Geothermal energy in the European Union: A review of the resource's potential, market penetration and energy system contribution. Energy Policy, 126, 155-168. https://doi.org/10.1016/j.enpol.2018.11.013.
Hughes, Z. (2022, May 19). Fuel in the Alaska Village of Noatak was $16 a gallon: The costs are more than just money. Anchorage Daily News. Retrieved fromhttps://www.adn.com/alaska-news/rural-alaska/2022/05/18/fuel-in-the-alaska-village-of-noatak-was-16-a-gallon-the-costs-are-more-than-just-money/.
Ramasamy, V., Zuboy, J., Woodhouse, M., O’Shaughnessy, E., Feldman, D., Desai, J., Walker, A., Margolis, R., & Basore, P. (2023) U.S. Solar Photovoltaic System and Energy Storage Cost Benchmarks, With Minimum Sustainable Price Analysis: Q1 2023. Golden, CO: National Renewable Energy Laboratory. NREL/TP-7A40-87303. Available at: https://www.nrel.gov/docs/fy23osti/87303.pdf
Andrews, R. W., Pollard, A., & Pearce, J. M. (2013). The Effects of Snowfall on Solar Photovoltaic Performance. Solar Energy, 92, 84–97. Available at: https://doi.org/10.1016/j.solener.2013.02.014.
Idem [10].
National Renewable Energy Laboratory. (2023). U.S. Solar Photovoltaic System and Energy Storage Cost Benchmarks, With Minimum Sustainable Price Analysis: Q1 2023. Golden, CO: NREL. Available at: https://www.nrel.gov/docs/fy23osti/87303.pdf
Singleton, R., Holman, R. C., Plant, R., Yorita, K. L., Holve, S., Manangan, A., & Redd, J. T. (2006). Trends in lower respiratory tract infection hospitalizations among American Indian/Alaska Native children and the general US child population. The Journal of Pediatrics, 149(3), 367-372. https://doi.org/10.1016/j.jpeds.2006.04.050
Laffey, K. G., Nelson, A. D., Laffey, M. J., Nguyen, Q., Sheets, L. R., & Schrum, A. G. (2021). Chronic respiratory disease disparity between American Indian/Alaska Native and white populations, 2011–2018. BMC Public Health, 21, Article 1466. https://doi.org/10.1186/s12889-021-11528-8
Lee, Henry and Windy Dewi. “Solar Energy in the Arctic: A Case Study of Northwest Alaska.” Belfer Center for Science and International Affairs, September 14, 2025