Research, ideas, and leadership for a more secure, peaceful world
Reports & Papers
from
Belfer Center for Science and International Affairs
The Revenue Potential and Country Exposure of a U.S. Border Carbon Adjustment
Using trade volume data, sectoral emissions intensity estimates, and jurisdiction-specific carbon pricing data, co-authors Ely Sandler, Christine Jiang, and Daniel Schrag calculate the potential impact of a U.S. border carbon adjustment under various design scenarios on a good-by-good and country-by-country basis.
A container ship is moored at the port of the port of New York and New Jersey in Elizabeth, New Jersey, Monday May 12, 2025.
Abstract
This paper estimates the revenue potential and country-by-country exposure of a U.S. Border Carbon Adjustment (BCA). BCAs are trade policy instruments that impose fees on imports based on carbon emissions intensity. By imposing these costs, BCAs help ensure competitive neutrality between domestic producers, who may face higher regulatory burdens or carbon taxes, and foreign exporters. While several legislative proposals for a BCA have emerged in the United States, including the Foreign Pollution Fee Act, the Clean Competition Act, and the Market Choice Act, there has been no comprehensive, granular analysis of the goods covered or the BCA’s fiscal impact. Using trade volume data from the U.S. Census Bureau, sectoral emissions intensity estimates from the Global Trade Analysis Project, and jurisdiction-specific carbon pricing data, we calculate the potential impact of a U.S. BCA under various design scenarios on a good-by-good and country-by-country basis. Our findings are preliminary, and do not account for key factors such as trade responses, which are likely to be large, therefore framing our figures as a likely upper-bound rather than prediction for revenue. Nonetheless, we estimate that a U.S. BCA modeled on the Clean Competition Act could generate $39.7 billion over a five-year period, or up to $85.5 billion depending on key policy parameters such as sectoral scope and carbon price. The Foreign Pollution Fee Act, which imposes a tax based on customs value rather than an explicit carbon price, could raise up to $198.1 billion over a five-year period. To understand the impact of a BCA on trade, we categorize all U.S. trading partners by exposure, and find that countries such as Mexico, China, Brazil, and India are most exposed given their high trade volumes and emissions intensity. In terms of competitiveness, we find that the United States is significantly less carbon intensive than most trading partners, suggesting U.S. firms may have an advantage in a world with more carbon pricing. We conclude by examining the impacts of different U.S. BCA design parameters, including the introduction of a national carbon price, and give recommendations for how a BCA could be successfully implemented.
Key Findings:
A U.S. BCA, if implemented in line with the Clean Competition Act (CCA), has an upper bound revenue potential of between $3.2 billion and $85.5 billion from 2026–2030, depending on the carbon price, sectoral scope, and potential exemption of least developed countries.
Under the Foreign Pollution Fee Act (FPFA), which uses a difference structure, the revenue potential over a five-year period is estimated to be $198.1 billion, effectively imposing a $1,200 a ton price on carbon.
The United States is significantly less carbon-intensive than most of its trading partners in core industrial sectors covered by BCA proposals, particularly aluminum, cement, paper, glass, and fertilizers, creating a potential competitive advantage for U.S. firms in a world with more carbon pricing.
Mexico, China, Brazil, and India are among the most exposed countries to a U.S. BCA due to high trade volumes and carbon intensity. Canada, while highly exposed, currently has a robust domestic carbon price, and could largely avoid BCA bills if the domestic regime remains and such payments are deductible.
Pairing a BCA with a U.S. carbon price would expand revenue potential by taxing all emissions and also help U.S. firms maintain a carbon advantage, as America’s low cost of capital and high innovation capacity means that U.S. firms are well-placed to decarbonize and outcompete rivals in a “carbon price world.”
Executive Summary
This paper provides a detailed analysis of the potential revenue and trade impact of a U.S. Border Carbon Adjustment (BCA), a policy that would impose fees on carbon-intensive imports to level the playing field between domestic producers and foreign competitors. Using trade data from the U.S. Census Bureau, country- and sector-specific emissions intensity from the Global Trade Analysis Project (GTAP), and carbon pricing information from the World Bank, we estimate the potential fiscal and economic outcomes of the Clean Competition Act (CCA), a Democrat-led bill, and the Foreign Pollution Fee Act (FPFA), introduced by Republican Senator Bill Cassidy.
We find that the CCA has the potential to raise between $3.2 billion and $85.5 billion over a five-year period (2026–2030), without accounting for trade responses. This outcome depends on the carbon price applied, the emissions threshold at which the tariff is triggered, and whether least-developed countries (LDCs) are exempt. The Foreign Pollution Fee Act, the Republican bill which follows an ad valorem tariff structure instead of a traditional BCA design, could generate up to $198.1 billion over the same period, effectively equating to a $1,200 per ton price on carbon for imports to the United States. While these estimates are preliminary, and likely represent an upper-bound given they do not account for potential responses from U.S. trading partners, such revenues would be comparable in magnitude to total U.S. tariff collections and represent a major source of funding.
To understand the impact of a BCA on U.S. trading partners, we create a “U.S. BCA Exposure Index” for both the FPFA and CCA. We categorize all U.S. trading partners by exposure to the BCA, showing both the potential cost in dollar terms, and an exposure index by percentage of total exports. Based on this index, we categorize countries into five categories of BCA exposure, reflecting on their relative level of exposure. Several outlier countries - most notably Mexico, China, Brazil, and India - face significant exposure under a BCA due to the scale and emissions profile of their exports to the United States. In contrast, countries with domestic carbon prices close to or above U.S. levels - such as members of the European Union - would be largely shielded from liability.
CCA Annual Revenue for Top 20 Countries (Year 1, Scenario 3, $55/tCO2)
(in million USD)
Total
Fossil fuels
Paper & pulp
Chemicals
Fertilizers
Glass
Cement, lime & gypsum
Iron & steel
Aluminum
1
Mexico
$1,850.00
$1,464.70
$3.14
$124.46
$12.21
$57.34
$20.86
$160.09
$7.20
2
Nigeria
$633.64
$623.11
$0.00
$2.00
$8.53
$0.00
$0.00
$0.00
$0.00
3
Brazil
$539.64
$171.65
$24.24
$26.15
$0.31
$0.45
$0.14
$283.92
$32.77
4
India
$406.09
$73.22
$1.97
$61.47
$5.98
$5.17
$1.48
$240.72
$16.09
5
China
$384.68
$6.38
$0.39
$247.21
$3.79
$48.13
$4.00
$62.17
$12.60
6
South Korea
$274.68
$142.56
$3.60
$47.78
$0.52
$2.05
$0.41
$75.19
$2.56
7
Trinidad and Tobago
$252.42
$188.86
$0.00
$22.13
$5.17
$0.00
$0.00
$36.25
$0.00
8
Saudi Arabia
$243.66
$200.86
$0.00
$10.15
$26.94
$0.20
$0.44
$2.26
$2.82
9
South Africa
$190.11
$9.82
$0.16
$125.50
$0.09
$0.02
$0.01
$48.07
$6.44
10
Colombia
$183.95
$178.42
$0.42
$2.45
$0.29
$0.54
$0.37
$1.39
$0.08
11
Russia
$180.01
$0.03
$0.00
$42.23
$98.65
$0.04
$0.00
$37.49
$1.57
12
Qatar
$176.39
$145.51
$0.00
$4.52
$24.78
$0.00
$0.00
$0.03
$1.54
13
Algeria
$129.20
$73.85
$0.00
$0.21
$7.10
$0.00
$2.04
$46.00
$0.00
14
Iraq
$125.41
$125.41
$0.00
$0.00
$0.00
$0.00
$0.00
$0.00
$0.00
15
Venezuela
$109.76
$107.69
$0.00
$1.70
$0.00
$0.02
$0.00
$0.00
$0.36
16
Ukraine
$104.32
$0.07
$0.09
$1.75
$0.01
$0.04
$0.00
$102.36
$0.01
17
Turkey
$71.61
$31.66
$0.45
$11.81
$0.02
$2.14
$11.79
$10.50
$3.23
18
Taiwan
$62.33
$22.81
$0.27
$23.24
$0.42
$3.43
$0.43
$11.59
$0.14
19
Ecuador
$56.53
$54.29
$0.00
$0.01
$0.00
$0.02
$0.01
$0.00
$2.20
20
Brunei
$55.23
$0.00
$0.00
$54.91
$0.00
$0.00
$0.00
$0.32
$0.00
FPFA Annual Revenue for Top 20 Countries
(In million USD)
Total
Fertilizers
Glass
Cement
Iron & steel
Aluminum
Hydrogen
Solar products
Battery inputs
1
Canada
$11,105.41
$382.81
$31.25
$58.79
$3,528.76
$6,805.11
$2.44
$30.18
$266.06
2
Mexico
$3,796.59
$205.47
$964.52
$350.90
$1,601.90
$236.22
$0.00
$119.03
$318.56
3
Brazil
$3,453.18
$1.40
$2.01
$0.65
$2,893.43
$542.64
$0.00
$4.20
$8.85
4
China
$3,391.18
$71.19
$904.41
$75.20
$859.79
$582.67
$0.02
$771.76
$126.15
5
Russia
$1,596.55
$1,350.97
$0.49
$0.00
$201.53
$43.56
$0.00
$0.00
$0.00
6
India
$1,565.33
$70.04
$60.56
$17.34
$781.23
$627.00
$0.00
$5.75
$3.41
7
Vietnam
$960.13
$0.96
$4.54
$16.65
$26.71
$7.60
$0.00
$897.03
$6.64
8
South Africa
$908.41
$1.73
$0.32
$0.21
$659.96
$241.71
$0.00
$1.53
$2.95
9
Australia
$833.14
$5.00
$0.50
$0.01
$18.60
$601.55
$0.00
$4.01
$203.48
10
Ukraine
$711.40
$0.23
$0.75
$0.06
$709.62
$0.20
$0.06
$0.13
$0.35
11
Taiwan
$679.26
$1.57
$12.79
$1.61
$50.90
$3.47
$0.03
$580.44
$28.45
12
Bahrain
$641.58
$0.83
$1.11
$0.00
$0.01
$639.49
$0.00
$0.04
$0.10
13
Saudi Arabia
$514.27
$431.81
$3.25
$7.02
$4.71
$55.45
$0.00
$1.91
$10.13
14
Thailand
$505.86
$0.68
$2.49
$1.92
$24.85
$8.12
$0.01
$466.61
$1.18
15
Malaysia
$479.20
$0.05
$3.90
$0.93
$20.01
$39.84
$0.00
$401.97
$12.49
16
South Korea
$456.05
$3.28
$12.91
$2.61
$168.23
$24.94
$0.00
$211.42
$32.67
17
Algeria
$428.54
$108.77
$0.03
$31.25
$288.48
$0.00
$0.00
$0.02
$0.00
18
Japan
$416.82
$2.87
$17.92
$0.05
$97.13
$5.88
$0.00
$292.97
$0.00
19
Trinidad and Tobago
$400.75
$30.00
$0.00
$0.00
$370.14
$0.00
$0.02
$0.31
$0.28
20
Qatar
$352.01
$337.14
$0.05
$0.00
$0.13
$13.70
$0.00
$0.18
$0.82
In terms of competitiveness, we find the United States to be significantly less carbon-intensive than most of its trading partners across BCA sectors. In aluminum, cement, paper, and fertilizers, U.S. production is substantially cleaner than the majority of imports by value. As global markets move toward carbon pricing, this emissions advantage suggests that a BCA could strengthen the competitiveness of U.S. industry, potentially supporting the reduction of America’s trade deficit.
A key outstanding question for the U.S. BCA is whether to pair the external carbon tariff with a domestic carbon price. While the CCA includes such a provision, the FPFA does not. In our discussion, we show that doing so would dramatically increase revenue by allowing the United States to tax all embedded emissions, not just those above a U.S. benchmark. It would also improve the credibility of the policy, reducing the risk of trade disputes. Perhaps most importantly, a domestic carbon price would provide a clear incentive for U.S. firms to invest in decarbonization. Given America’s low cost of capital, high innovation capacity, and cleaner industrial fuel mix, U.S. firms are well-positioned to compete in a carbon-constrained global economy. Without a domestic carbon price, however, the United States risks falling behind as other countries scale low-carbon production.
The politics of national carbon pricing in the United States are complex. In the past two decades, efforts to establish a national carbon price have failed repeatedly in Congress. While a standalone border carbon adjustments like the FPFA could deliver substantial fiscal revenues and strengthen U.S. industrial competitiveness in the near term, our analysis shows clear economic benefits to American producers and taxpayers of pairing a U.S. BCA with a domestic carbon price. This would not only boost the substantial competitiveness and revenue effects of the policy, but also ensure America’s carbon advantage does not erode without an incentive to reduce emissions.
1. Introduction
1.1. Background to Border Carbon Adjustments
Border carbon adjustments (BCAs) are a trade policy instrument designed to address competitiveness distortions caused by differences in environmental regulations and practices across jurisdictions (Böhringer, Balistreri and Rutherford, 2012; Condon and Ignaciuk, 2013). By imposing a charge on imported goods based on carbon intensity, BCAs “level the playing field” between domestic producers and foreign exporters. This mitigates the risk of carbon leakage, i.e., the relocation of production to regions with weaker environmental policies (Clausing and Wolfram, 2023). Typically, BCAs align their tariff rates with domestic carbon prices, ensuring that imports face comparable costs to domestic goods (Cosbey et al., 2019).
BCAs represent a form of carbon pricing, an economic policy tool that assigns a cost to firms’ carbon dioxide (CO2) emissions, either through a direct tax or a market-based trading system (Aldy and Stavins, 2012). Carbon pricing transforms firms’ CO2 emissions from unpriced externalities into a tax liability, creating financial incentives for emissions reductions (Sandler and Schrag, 2024). At an international level, carbon pricing mechanisms now cover approximately 24% of global greenhouse gas emissions (World Bank, 2024). However, disparities in carbon pricing across countries can create trade distortions, reinforcing the rationale for BCAs as a complementary policy tool (Clausing and Wolfram, 2023).
At a design level, BCAs typically allow for firms to deduct the effective carbon price (ECP) paid by the exporter in their home jurisdiction (Brandi, 2021). This creates an incentive for more governments to institute carbon pricing, as their domestic exporters will in any case have to pay a carbon price, the question being simply whether to pay at home or abroad (Clausing et al., 2024).
The European Union’s Carbon Border Adjustment Mechanism (EU CBAM), which entered its transitional phase in 2023, is the first large-scale BCA enacted globally (Marcu, Mehling and Cosbey, 2020; Ursula von der Leyen, 2020; Assous et al., 2021). Because of the ECP deduction, the EU CBAM has already spurred interest in new carbon pricing measures globally, as countries including in Türkiye, Indonesia, and Brazil have all moved to implement carbon pricing, in part to keep revenue at home that would otherwise flow to Europe (East and Dept, 2023; Chang, 2025).
1.2. Carbon Pricing and BCAs in the United States
Historically, there have been several attempts to introduce carbon pricing in the United States at a federal level. In 2009, the 111th Congress introduced the American Clean Energy and Security Act (H.R. 2454), aiming to establish a cap-and-trade system like the EU Emissions Trading Scheme (ETS). The bill passed the House of Representatives but did not advance in the Senate. In 2019, the Energy Innovation and Carbon Dividend Act (H.R. 763) was introduced, proposing a carbon fee starting at $15 per metric ton of CO2, with revenues returned to citizens as a monthly dividend. Like in 2009, the bill did not advance through the legislature.
While a national carbon price has thus far failed to gain traction, several U.S. states have implemented local carbon pricing, primarily through cap-and-trade programs (Aldy et al., 2022). California operates a comprehensive cap-and-trade system covering multiple sectors. Washington State introduced a cap-and-invest program in 2021 that aims for a 95% reduction in emissions by 2050. The Regional Greenhouse Gas Initiative (RGGI) is a cooperative effort among 11 Northeastern and Mid-Atlantic states - Connecticut, Delaware, Maine, Maryland, Massachusetts, New Hampshire, New Jersey, New York, Rhode Island, Vermont, and Virginia - focused on capping and reducing CO2 emissions from the power sector. Massachusetts, in addition to participating in RGGI, has its own separate cap-and-trade program for its power sector, designed to extend through 2050.
Most recently, in part prompted by the EU CBAM, there have been numerous proposals from both major political parties for a U.S. BCA (Ramseur, Hite and Casey, 2024). The 118th Congress from 2023-2025 saw four BCA-related bills, including the PROVE IT Act mandating carbon intensity measurement for key industrial products, and three BCA proposals: the Foreign Pollution Fee Act (FPFA), the Clean Competition Act (CCA), and the MARKET CHOICE Act (MCA). These proposals provide blueprints for how a BCA might be designed in the United States, including in the 119th Congress (Rasool, Reinsch and Denamiel, 2024).
In December 2024, Senators Bill Cassidy and Lindsay Graham released a new draft of the FPFA, with a more explicit aim of levelling the playing field with Chinese manufacturing and “countering the unfair practices of non-market economies” (Cassidy and Graham, 2024). The new draft has been reintroduced to the Congressional debate, with a more specific sectoral scope and simplified classification of products into tiers based on their emissions intensity. At the same time, the CCA may also be reintroduced.
Key features of the three BCA-related bills – the latest draft of the Foreign Pollution Fee, the Clean Competition Act, and Market Choice Act – are shown in Table 1.
The proposals in Table 1 differ significantly in structure. The FPFA, for instance, is not a traditional carbon price since it applies a tariff on the customs value of imports, rather than the embedded carbon content of products (Cassidy and Graham, 2024). It also does not contain provisions for a domestic carbon tax. The CCA, on the other hand, applies a $55 tax to both domestic and foreign producers, with exemptions for LDCs and a stipulation on the use of proceeds for domestic decarbonization grants and multilateral assistance (118th United States Congress, 2024a). Similarly, the MCA covers both domestic and foreign producers but focuses solely on fossil fuel emissions, starting at a carbon price of $35, with a use of proceeds trust fund for infrastructure and R&D (118th United States Congress, 2024b).
1.3. Existing Literature on the Impact of a U.S. BCA
Given the growing momentum behind a U.S. BCA, a crucial question is how much individual countries would be required to pay across different goods. This figure, determined by the volume and carbon intensity of their exports, in turn shapes both the policy’s revenue potential for the United States and its trade impact abroad. Despite significant political backing and media coverage, this question remains understudied (Rennert et al., 2025).
Several financial analyses of a U.S. BCA are based on a working paper from the Office of Tax Analysis, Department of Treasury, which estimated in 2017 that a domestic carbon pricing scheme could generate $194 billion in tax revenue at a carbon price of $49/tCO2 (Horowitz et al., 2017). Two follow-up analyses suggested that an associated border carbon adjustment could generate an additional $12.2 billion to $21.8 billion per year (Pomerleau, 2021; Rasool, Reinsch and Denamiel, 2024).
While these figures present high-level estimates for a U.S. BCA’s revenue potential, and have therefore been widely cited in popular media, the methodologies for the calculations do not use actual trade volumes or country-specific data about carbon emissions. Instead, these estimates compare the overall carbon intensity of U.S.-produced goods to the rest of the world, and then proportionally scale the expected revenue for a BCA to the domestic carbon tax. For example, Pomerleau (2021) finds that that embedded emissions from net imports are 6.3% of total domestic emissions and therefore estimates a BCA’s revenue to be 6.3% of projected U.S. domestic carbon tax revenue, i.e., 6.3% of $194 billion, or $12.2 billion (Pomerleau, 2021). Other analysis conducted by the Center for Strategic and International Studies takes the Office of Tax Analysis estimate for the revenue potential of a U.S. domestic carbon price in 2021 and assumes a U.S. BCA could raise 10% of this amount because import-based CO2 emissions were 10% higher than domestic emissions, arriving at an estimate of $21.8 billion (Rasool, Reinsch and Denamiel, 2024).
Outside these high-level estimates based on scaling U.S. domestic carbon price revenue, a study by Global Efficiency Intelligence examined the impact of a U.S. BCA specifically on steel and aluminum, finding that the BCA could generate between $0.80 billion to $3.4 billion in annual revenue from steel and aluminum (Hasanbeigi, 2022). This figure is computed by combining import data, carbon intensity figures for domestic and foreign steel and aluminum production, and different carbon price scenarios. This methodology is most similar to the approach that this paper will take, though its scope is limited to steel and aluminum.
Since the FPFA was reintroduced in December 2024, the American Action Forum has generated an estimate that the tariff would raise between $19.2 billion to $25.3 billion per year (Pomerleau, 2025). This is calculated by applying the 15% flat tariff onto projected tariff base, plus revenue from the variable rate determined by the difference in carbon intensity between the United States and foreign producers.
Bistline et al. (2025) estimate that a bill like the CCA could generate $6 billion in 2035. While this study does use real trade volume data, the authors’ focus is on wider issues than the revenue impact of a BCA, and carbon intensity data is generalized to the economy level, rather than looking at specific sites or goods. This economy-wide carbon intensity is calculated as the exporting country’s CO2 emissions divided by its nominal GDP, with a carbon intensity adjustment for the industry, which is the Scope 1 CO2e emissions per USD $1m of revenue in that industry, relative to global economy-wide carbon intensity (calculated as global CO2 emissions per USD $1m of global nominal GDP).
Rennert et al. (2025) find that the FPFA could raise annual revenues of $33.3 billion over ten years. As we discuss later on, these estimates take account of trade responses from exporters to the United States using generalized assumptions about elasticity and an assumption of perfect competition. For example, the paper predicts that FPFA on higher carbon intensity countries such as China and Russia virtually eliminate imports of covered products from high emissions-intensity countries like China, eliminating all revenue.
Pomerleau (2025b) finds that the FPFA would raise $185.4 billion from 2026-2035 if enacted in isolation from other tariffs, although the author’s methodology for calculations are not disclosed. Like our estimates, these are likely upper-bound estimates as they do not account for trade responses or reductions in tariffs through an International Partnership Agreement.
Nystrom and Rorke (2025) estimate that a pollution import fee could generate between $80 billion and $165 billion over ten years, but the analysis does not use the exact parameters of the FPFA. Like Rennert et al. (2025), they also include a demand response with fixed elasticity.
In response to the methodological constraints of the work discussed above, this paper presents new estimates for the revenue generation potential of a U.S. BCA, based solely on real data, without national-level generalization. These estimates also do not accout for trade responses, and thus likely represent an upper-bound.
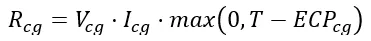
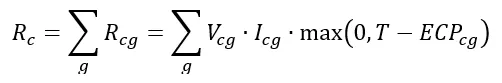
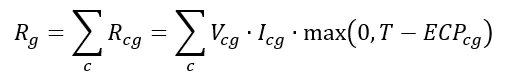
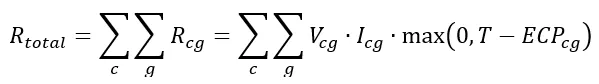
2. Methodology
In our scenario analysis we first evaluate a traditional BCA design, comparable to the MCA and CCA. This estimates the tariff revenue a potential U.S. BCA based on a fixed charge applied per ton of CO2 embedded in imports from covered sectors. We then present an additional scenario for the FPFA, which is based upon customs value taxation instead of a traditional carbon price.
For our scenarios base on the CCA and MCA, the revenue generated by a U.S. BCA for each unique country-product combination is expressed as follows:
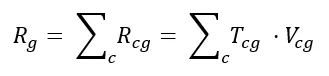
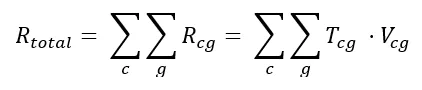
Where
Rcg = BCA revenue collected from country c for good g (USD MM)
Vcg = Volume of U.S. imports from country c for good g (USD MM customs value)
Icg = CO2 intensity, in country c for good g (MtCO2 per USD MM of good)
T = U.S. BCA carbon tax per ton of CO2 (USD)
ECPcg = Effective Carbon Price in country c for good g (USD)
The sum of revenue for a specific country across all goods is therefore expressed as:
The sum of revenue for a specific good across all countries is expressed as:
The total aggregate revenue across all countries for all goods is expressed as:
To calculate Rtotal, i.e., the revenue potential of a U.S. BCA, we start with a dataset of customs values of imports into the United States by country of origin from the United States Census Bureau. We then match each import by origin and good to emissions intensity data from Purdue University’s Global Trade Analysis Project (GTAP) database to determine the quantity of taxable emissions per unit of trade (Aguiar et al., 2022). Finally, we make assumptions based on recent legislative proposals about the applicable sectoral scope of the U.S. BCA, the price per ton of CO2, deduction of ECPs, and potential exemption of LDCs.
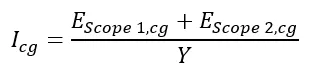
2.1. Emissions Intensity
To understand the embedded emissions data in U.S. imports, we use data from GTAP for country-level energy consumption and emissions from the latest reference year, 2017 (Aguiar et al., 2022). To create a sectoral emissions intensity value, we summed Scope 1 and Scope 2 emissions (MtCO2) at the country level and divided this figure by the value of outputs (denoted in million USD). This calculation is given by:
Where
EScope 1,cg = Absolute scope 1 emissions for a good g in country c (MtCO2)
EScope 2,cg = Absolute scope 2 emissions for a good g in country c (MtCO2)
Ycg = Monetary output value (million USD)
Since the GTAP database does not present emissions data using the Scope 1, 2 and 3 frameworks of the Greenhouse Gas Protocol, we undertake additional steps to calculate a Scope 1 and 2-equivalent emissions figure from constituent variables in the GTAP dataset.1
Scope 1 Absolute Emissions
To calculate Scope 1 emissions, we sum emissions from firms' domestic and imported use of all fuels within a specific sector, which are denoted by the variables “MDF” and “MMF” in GTAP. This generates the absolute emissions from direct combustion of fossil fuels by that sector, which corresponds to Scope 1 emissions.
Scope 2 Absolute Emissions
To calculate Scope 2 emissions, we begin by applying the same method used for Scope 1 emissions to each country’s electricity sector. Because Scope 2 refers to emissions associated with the generation of purchased energy, we can express different sectors’ Scope 2 emissions as a share of the country’s Scope 1 electricity-sector emissions, based on their energy consumption. We use GTAP’s Energy Volumes Data to distribute electricity generation-related emissions among sectors based on each sector’s share of national energy consumption. This yields the Scope 2 emissions for every sector-country combination.
Carbon Intensity
To calculate carbon intensity per dollar value of a good, we use GTAP data on the monetary value of output across sectors and countries. This is given by the GTAP variable “OUTDISP.” For each sector-country combination, we sum absolute emissions across Scopes 1 and 2 and divide this sum by the output value.
One point of departure between our methodology and that of a potential U.S. BCA is the expression of trade volumes in monetary terms. Many BCA proposals, for example the CCA, multiply the weight of the good by the emissions intensity, expressed in tCO2. Our calculation instead computes emissions intensity in USD, rather than weight. This is because trade volumes are most commonly denominated in USD, not tons (U.S. Census Bureau, 2025). Since emissions intensity figures denominated in USD can be converted into emissions intensity by weight, using the price of the commodity, this point is noted for its departure from convention, rather than a cause for over- or under-estimation.
2.2. Import Volumes
To determine the quantity of taxable goods imported to the United States, our analysis uses trade data published by the United States Census Bureau, which provides customs values of all imports into the United States, across sectors, based on country of origin (U.S. Census Bureau, 2025). We use the customs values for 2023 – the most recent calendar year for which there is full-year data available at the time of our analysis.
Next, we filter for import data for products that would likely be considered in-scope for a U.S. BCA. For this analysis, we include fossil fuels, cement, aluminum, iron and steel, fertilizer, paper and pulp, and glass. This sectoral scope is modeled after the CCA which provides the most granular list of sectors and uses the same sectoral classification system (NAICS) as U.S. Census Bureau. By contrast, the MCA defines the sectoral scope as “eligible industrial sector” and does not provide an exhaustive list of taxable sectors using NAICS codes.
2.3. Carbon Price
There is significant uncertainty about how carbon would be priced in a U.S. BCA (Kell, McGough and Forshaw, 2020; Aldy et al., 2022; Döbbeling-Hildebrandt et al., 2024). To address this uncertainty, we analyze a range of carbon prices starting at $15/tCO2, with $55 as a middle value to match the CCA, and $95 as a maximum, reflecting the price of EU ETS allowances. In addition, we follow the CCA proposal with annual increases of 5% plus the consumer price index.
2.4. Effective Carbon Prices (ECPs)
Standard BCA design allows the deduction of an ECP paid in the exporter’s home jurisdiction (Clausing et al., 2024). An example of this is Article 9 of the EU CBAM legislation, which makes a provision for the “reduction in the number of CBAM certifications to be surrendered” based on Article 2’s definition of any “carbon price that has effectively been paid in the country of origin” (European Union, 2023). The CCA and MCA include such provisions, though no adjustment is explicitly mentioned in the FPFA.
To model the expected effect that the ECP reduction will have on the revenue of a U.S. BCA, we use jurisdiction-specific data on carbon pricing from the World Bank’s Carbon Pricing Dashboard (World Bank, 2024)
2.5. The Foreign Pollution Fee Act
A structurally distinct legislative proposal to the CCA and MCA is the FPFA, which was re-introduced in April 2025 by Senators Bill Cassidy (S.1325, 119th Congress, 2025) after the initial proposal expired without being passed in the last Congressional session (Cassidy and Graham, 2024).
Unlike traditional BCAs, the FPFA proposes to impose an ad valorem tax, which means that the tariff amount is calculated as a percentage of the customs value of the product exported rather than as an explicit carbon tax. The FPFA covers eight categories of goods: aluminum, cement, iron and steel, fertilizer, glass, hydrogen, solar products, and battery inputs. In contrast to the CCA, the FPFA proposal excludes imports of fossil fuels and related products, as well as chemicals.
The current FPFA is structured with a transitional period of up to 12 months before a full pollution intensity calculation methodology is published. During this transitional period, the variable charge with respect to each covered good and country of origin will follow a schedule set out in section 4693(a)(1) of the FPFA. This schedule can be found in Appendix IV.
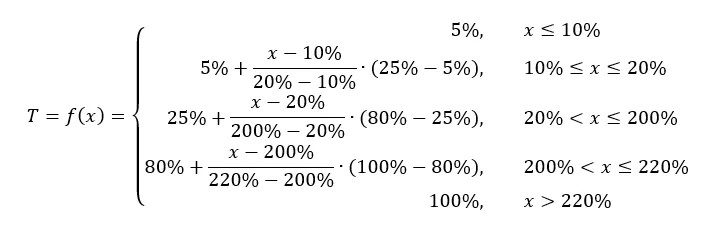
After the transitional period, and for the subsequent 36 months, the variable charge shall be determined in accordance with the following fee schedule:
If the difference in emissions intensity, x, is
The the corresponding variable charge, T, is
x ≤ 10%
0%
10% < x ≤ 20%
5-25% (increasing linearly)
20% < x ≤ 200%
25-80% (increasing linearly)
200% < x ≤ 220%
80-100% (increasing linearly)
x ≥ 220%
100%
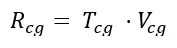
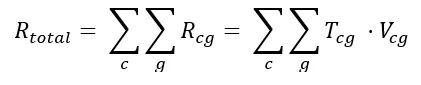
To model the revenue generation potential of a BCA structured as an ad valorem tax such as the FPFA, the revenue for each unique country-product combination is expressed as follows:
where
Rcg = BCA revenue collected from country c for good g (USD MM)
Tcg = Variable charge, for country c of good g (Percentage)
Vcg = Volume of U.S. imports from country c of good g (USD MM customs value)
The sum of revenue for a specific good across all countries is expressed as:
The total aggregate revenue across all countries for all goods is expressed as:
2.6. Limitations of Our Methodology
This paper computes the potential revenue of a U.S. BCA using four input sources: (1) trade volumes from the U.S. Census Bureau (2024); (2) sector-based, country-specific emissions intensity calculated based on the GTAP (Aguiar et al., 2022); (3) global carbon prices from the World Bank’s Carbon Pricing Dashboard (World Bank, 2024); (4) BCA design parameters based on the BCA proposals before the U.S. Congress. Nonetheless, there are several potential sources of discrepancy between our methodology and revenue from an actual BCA.
First, our emissions intensity dataset does not cover all jurisdictions that exported into the United States in 2024. As a proportion of the value of all covered goods, around 1.7%, or $6.9 billion worth of goods, does not have an associated emissions intensity value, and the tariff amount is considered nil. This may inadvertently lead to a relatively small under-estimation of the total revenue generated from a BCA. This under-estimation is particularly relevant for least-developed countries, as of the $6.9 billion worth of goods, $1.3 billion originates from LDCs.
Second, volumes of trade, carbon pricing, and carbon intensity of exports are all subject to change by the time a U.S. BCA is implemented. We use a static view of import volumes from the full-year of 2023, carbon intensity data from the GTAP 11 Data Base which contains 2017 data as the most recent reference year, and carbon pricing data from the World Bank’s 2024 update. Trade volumes fluctuate year-on-year based on market dynamics and economic shifts; carbon intensity changes over time as industries innovate and under regulatory pressure; carbon pricing is directly linked to changes in government policy. The full enactment of a carbon price typically has a years-long lead time, and the responses of trading partners in the intervening period can have a significant impact (Edenhofer and Kalkuhl, 2011; Hoel, 2012). For example, the EU CBAM entered into force in 2023 and is expected to take effect from 2026 (The Economist, 2023). Similarly, the UK government began consultations on the UK CBAM in 2024 and is expected to begin implementation from 2027 (HM Treasury and Department for Energy Security & Net Zero, 2023). This lead time provides trading partners with an anticipatory window to prepare, including via decarbonization measures to lower goods’ emissions intensity or trade realignment to send goods to jurisdictions without BCAs (Clausing et al., 2024).
To understand the potential magnitude of the trade effect, Rennert et al. (2025) project that FPFA could lead to substantial trade reallocation, favoring exporters with lower carbon intensities. Their analysis is based on a Global Economic Model (GEM) which simulates global trade flows in response to carbon pricing shocks. While such modeling provides valuable insights into potential directional shifts in trade patterns, it relies on strong simplifying assumptions, for example aggregating all non-G20 countries into regional blocs, assigning them uniform carbon intensities and trade elasticities, and applying fixed substitution elasticities. These methodological choices are necessary but also introduce uncertainty regarding the magnitude and granularity of real-world responses. For this reason, we interpret these results as indicative rather than predictive. Nevertheless, the findings are directionally robust: imports of covered products are expected to decline from high-carbon-intensity exporters subject to the tariff (e.g., China, Mexico, India), and rise from countries with lower carbon intensity manufacturing that are exempt (e.g., EU, UK, and Japan).
Third, there is uncertainty about the emissions intensity in our dataset, both in terms of the accuracy of the data and the difference between country-level averages and firm-specific reporting. Emissions data, especially at the country level, tends to contain gaps relating to inconsistent reporting standards, use of proxies (such as the use of sectors’ share of energy consumption for calculating Scope 2 emissions), and differences in industry emissions measurement and reporting practices. Furthermore, while GTAP allows us to compute a national emissions intensity, it does not capture heterogeneity in emissions intensity between production sites with a country. Emissions can vary significantly based on differences in input fuels, technology-enabled energy efficiency, operational practices, etc. This creates the potential for strategic "re-shuffling" by exporting countries whereby countries direct their lowest-carbon products to markets subject to a carbon border tax to minimize their tariff liabilities. If a BCA makes provisions for site-level reporting of emissions intensity data, the difference between the country-level averages used in our analysis and the actual emissions profile of goods may go unaccounted for.
Fourth, while we use the World Bank dataset for local carbon prices, uncertainty remains about what a U.S. BCA would consider as an ECP. Since the U.S. Census dataset considers trade partners on a country level, we use national or supranational carbon prices. In practice, sub-national jurisdictions may have additional carbon prices. For example, the state of Yucatan in Mexico has a carbon price, which is $13 higher than Mexico’s national carbon price (World Bank, 2024). Our model, however, assumes that an exporter from Yucatan can only deduct the national, not the state, carbon price. Similarly, in addition to the EU ETS, individual European countries have national carbon prices, but our model assumes that European exporters to the United States will only be able to deduct the EU ETS. To account for such sub-national ECPs, one solution would be to use more granular datasets such as the OECD “effective carbon rate,” which takes a more expansive view of carbon prices (Garsous et al., 2023).
In addition to the nominal level of the carbon price, our model assumes that every carbon pricing scheme included in the World Bank database will cover all goods and all emissions from production (as opposed to only covering emissions above a certain threshold). In reality, sectoral coverage is heterogenous, i.e., carbon prices cover some goods but not all exports, and most jurisdictions have a phase-in schedule for their carbon pricing scheme. Two examples illustrate the complexity of carbon pricing coverage: China’s national ETS only covers the power sector, but our model assumes that a Chinese exporter of glass products to the United States will be able to net off a domestic carbon price paid on its glass exports. In the EU ETS, free allowances are expected to be phased out gradually over a nine-year period to coincide with the phase-in of the CBAM. In our model, we assume that EU exporters to the United States will be able to deduct the full carbon tax on all taxable emissions, including the portion of emissions that is currently covered by free allowances.
Fifth, within our dataset itself, there is not a perfect match between the expected sectoral coverage of a U.S. BCA and trade volume data. The trade volumes reported in the U.S. Census dataset are aggregated at the four-digit NAICS level, i.e., at a broader, industry sector level. However, sector coverage is often more specific (e.g., the CCA uses six-digit codes, corresponding to more specific sub-sectors). For example, the CCA specifies that “327310 (cement)” is part of the list of covered industries. However, the U.S. Census dataset only reports import volumes at the four-digit level, for “3273 Cement and Concrete Products,” which includes not just 327310 (cement), but also 327320 (ready-mix concrete manufacturing), 32731 (concrete block and brick manufacturing), 327332 (concrete pipe manufacturing), and 327390 (other concrete product manufacturing). This represents a potential overestimation of the dollar value of cement imports that would be subject to a BCA, and therefore a potential overestimation of the revenue impact of a U.S. BCA.
Specific Limitations of Our Methodology for the Foreign Pollution Fee Act
The FPFA defines its sectoral coverage using Harmonized System (HS) codes, an alternative classification system to NAICS. Equivalent sector codes can be identified across the two systems. For sectors covered under both the FPFA and the CCA – namely iron and steel, aluminum, fertilizer, cement, and glass – we derived import volumes based on their equivalent NAICS codes. This is done to ensure consistency in methodology across our analysis of the CCA and the FPFA, and to enable comparison in the implied carbon price across the core set of overlapping sectors (see Section 4.1 below). However, for sectors that fall only within the scope of the FPFA – namely hydrogen, solar products, and battery inputs – emissions intensity data is not available in GTAP. This means that instead we rely on the published variable charge in the FPFA’s initial application, as specified in section 4693(a)(1). This may create some inaccuracy in the final revenue estimation, though these goods represent only 9.6% of the customs value of FPFA imports. We derive import volumes for these sectors the from 6-digit HS trade data provided by the U.S. Census Bureau, the same data source used for CCA analysis.
In addition, one source of underestimation of revenue potential in our analysis is that we have not factored in the multipliers envisioned by the FPFA that can apply to non-market economies. Section 4693(a)(2) sets a variable charge multiplier of 2.0 for products from nonmarket economies, and a separate multiplier of 2.0 for products produced in a facility “which is owned or controlled by a foreign entity of concern.” The multiplier can increase to up to 4.0 for products made in a facility owned by foreign entity of concern in a nonmarket economy. Since the draft legislative act does not specify the countries considered to be nonmarket economies, and does not designate any foreign entity of concern, we did not apply the multipliers to any country-good combinations in our analysis. However, such analysis would be simple to calculate based on the figures in Appendix II.
3. Results
Our scenario analyses find that a U.S. BCA, modelled on the CCA, could generate anywhere from $3.2 billion to $85.5 billion in the five-year period from 2026 to 2030. This range reflects the potential variation in three key design parameters for the U.S. BCA: the carbon price; the exemption of LDCs; and the level at which the BCA starts to apply. Using the FPFA design, we calculate that the BCA could generate up to $198.1 billion over a five-year period.
3.1. CCA Scenario Analysis
Design Parameters
A BCA designed following the structure of the CCA has several possible design parameters that we vary during our scenario analysis. First, regarding the carbon price. All our scenarios test a range of carbon prices starting at $15/tCO2 to reflect a potential lower bound. We show $20 increments, with $55/tCO2 as a midpoint reflecting the CCA price and $95/tCO2 as an upper bound, reflecting the highest price of the EU ETS.
Second, regarding the exemption of LDCs, the United States will need to decide whether to exempt less-developed trading partners. Exemptions for LDCs are a standard option in BCA design, aimed to mitigate their potential negative developmental impact (Ruiz, 2023). As an example, exemptions were debated during EU CBAM legislative process, though ultimately rejected (Hua, 2023).
Finally, regarding the level of emissions intensity at which the BCA starts to apply. This hinges on whether the United States implements a national carbon price alongside the BCA. If a domestic carbon price is implemented, such as is proposed under the MCA and CCA, it would be logical to apply the BCA to all emissions.
Without a national carbon price, as under the FPFA, it is unlikely the United States would tax all emissions. Instead, by taxing only emissions above the average U.S. intensity, a BCA would impose a general carbon tariff with a universal exemption, equivalent to granting all firms - both American and foreign - free allowances up to the average U.S. emissions intensity. Nonetheless, despite technically treating all firms equally, the political reality may differ, and the merits of this approach are discussed in our conclusion.
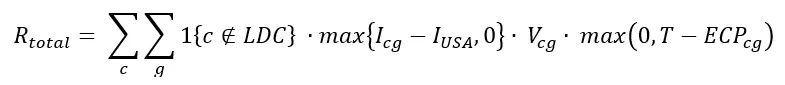
Scenario 1: Exempting LDCs and only taxing emissions above U.S. intensity
Under Scenario 1, LDCs are exempt from reporting requirements and only emissions above the U.S. average emissions intensity are taxed. This is expressed by the following equation:
Where
1{c ∉ LDC} is an indicator function that equals to 1 for countries that are not LDCs, and 0 for LDCs
At a low carbon price of $15/tCO2, Scenario 1 generates $4.4 billion in a five-year period. At the CCA starting carbon price of $55/tCO2, it generates $18.9 billion. At a high carbon price of $95/tCO2, Scenario 1 generates $35.3 billion across five years.
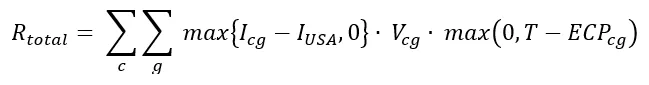
Scenario 2: Not exempting LDCs and only taxing emissions above U.S. intensity
Under Scenario 2, we no longer exempt LDCs from the BCA but continue to tax only emissions above a U.S. benchmark:
At a low carbon price of $15/tCO2, this scenario generates $4.4 billion in a five-year period. At the CCA’s suggested starting carbon price of $55/tCO2, it generates $18.9 billion in a five-year period. Finally, at a high carbon price of $95/tCO2, it generates $35.3 billion in revenue across five years. The difference in revenue generation potential in a five-year period across Scenarios 1 and 2 is around $2 million at a low carbon price, and around $7 million at the high carbon price. This suggests that an LDC exemption has a relatively small impact on the revenue generation potential of the CCA.
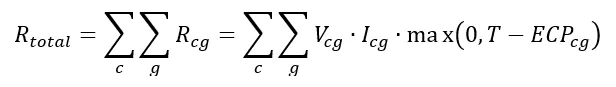
Scenario 3: Not exempting LDCs and taxing all emissions
Under Scenario 3, we remove the assumption that LDCs would be exempt from a BCA, and tax all emissions, not just the portion above a U.S. benchmark. This scenario is the same as the original equation presented in the methodology section, as it assumes no exemptions and taxes all emissions:
At a lower bound carbon price of $15/tCO2, Scenario 3 generates $8.7 billion in a five-year period, increasing to $39.7 billion at the CCA price of $55/tCO2. At a high carbon price of $95/tCO2, Scenario 3 generates $85.5 billion across five years.
Overall Scenario Analysis
To compare scenarios, the sensitivity analysis below sets out BCA five-year projected revenues under different starting carbon prices, increasing at 5% per annum plus an additional 2% adjustment for inflation.
It is important to note that, while the EU CBAM is phasing in its charge over a nine-year period to coincide with the phase-out of free allowances, our model does not apply an equivalent phase-in schedule. The reason for this is that, since there is no domestic carbon pricing scheme in the United States, there is no free allowance phase-out schedule to mirror. However, without a phase-in mechanism, foreign producers could face a sudden and significant cost increase when exporting to the United States, potentially leading to trade disputes or economic disruptions. Additionally, a full and immediate BCA could increase compliance and enforcement challenges.
In addition to Scenarios 1-3, we analyze revenue generation potential using the design of the FPFA. The sectoral scope of the FPFA excludes fossil fuels and related products, chemicals, but includes solar products and battery inputs. Broadly speaking, the FPFA applies an ad valorem tax to the custom value of goods imported, which is based on the difference in carbon intensity between a good made in the country of origin and a good made in the United States. The FPFA contains a published schedule of variable charges for an initial period of up to 12 months, and then a tiered variable charge schedule for the subsequent 36-month period. For the purposes of our scenario analysis, we will extend the applicable time period of the tiered variable charge schedule from three years to four years. This allows us to generate a revenue estimate across a five-year period (one year of fixed fee schedule followed by four years of tiered fee schedule) that is comparable to the calculated revenue potential of the CCA in Scenarios 1-3.
Scenario 4: Applying the fixed fee schedule for one year and then the tiered fee schedule for the subsequent four years
Under our Scenario 4, we apply the equation:
To find the value for T for each country-good combination in the first year, we apply the schedule published in section 4693(a)(1), which sets out the variable charges for each covered good for 25 countries, and default variable charge figures for the rest of world. This schedule can be found in Appendix IV.
Under Scenario 4, we find that the FPFA can generate $45.3 billion in the initial year.
Next, to find the value for T for each country-good combination in the subsequent four years, we apply the following piecewise function, where x is the percentage difference in carbon intensity for a given good between the country of origin and the United States.
We find that using the tiered fee schedule, the FPFA can generate $38.2 billion a year, or $152.8 billion in four years. The difference in the one-year revenue potential between the fixed fee schedule and tiered fee schedule suggests that the fixed fee schedule, on aggregate, over-states the difference in emissions intensity between the United States and its trade partners.
Across a five-year period, assuming that the fixed fee schedule will apply in the first year and that the tiered fee schedule will apply for the subsequent four years, the FPFA has the potential to generate $198.1 billion.
3.3. Country Exposure and Revenue Breakdown
To understand how each U.S. trading partner will be affected by a BCA, we can look at several measures to determine country exposure. In Table 3 we present the countries from which a U.S. BCA would generate the most revenue, broken down by good. As can be seen, Mexico is most exposed, and at a carbon price of $55/tCO2, a BCA would impose an effective tariff of 5.3% on covered industrial goods. The next two most-affected countries are Nigeria and Brazil, facing an effective tariff of 11.6% and 3.3% on covered products, respectively. India, whose exports to the United States represent around 20% of their total exports (‘Observatory of Economic Complexity’, 2024), would face an effective tariff of 3.7% tariff on BCA-relevant goods.
China is expected to be significantly impacted by a BCA, driven by large import volumes and Chinese production being more carbon-intensive than the United States in all covered goods. Under Scenarios 1 & 2 – where only emissions exceeding the U.S. benchmark are taxed – it generates $152 million per annum; under Scenario 3 – where all emissions are taxed – it generates $384 million per annum. The chemical industry accounts for the majority of China’s BCA exposure, representing 64% of total revenues raised from the country.
There are no LDCs in the top 20 overall revenue-generating countries, or in the list of top ten revenue generators for any of the covered goods, echoing the earlier finding that LDCs make up an insignificant share of potential BCA revenue. In fact, for the LDCs for which carbon intensity data is available, their total expected revenue generation potential at a carbon price of $55/tCO2 comes to around $700,000 if only emissions above U.S. intensity are taxed, or around $1 million if all emissions are taxed. However, this may represent an under-estimate due to lack of availability of carbon intensity data for some LDCs. Most notably, our dataset lacks carbon intensity information for Angola, an exporter of fossil fuels to the United States, which contributes to around $1.02 billion out of $1.27 billion in value of covered goods from LDCs.
Table 3 - Annual Revenue for Top 20 Countries (Year 1, Scenario 3, $55/tCO2)
(In million USD)
Total
Fossil fuels
Paper & pulp
Chemicals
Fertilizers
Glass
Cement, lime & gypsum
Iron & steel
Aluminum
1
Mexico
$1,850.00
$1,464.70
$3.14
$124.46
$12.21
$57.34
$20.86
$160.09
$7.20
2
Nigeria
$633.64
$623.11
$0.00
$2.00
$8.53
$0.00
$0.00
$0.00
$0.00
3
Brazil
$539.64
$171.65
$24.24
$26.15
$0.31
$0.45
$0.14
$283.92
$32.77
4
India
$406.09
$73.22
$1.97
$61.47
$5.98
$5.17
$1.48
$240.72
$16.09
5
China
$384.68
$6.38
$0.39
$247.21
$3.79
$48.13
$4.00
$62.17
$12.60
6
South Korea
$274.68
$142.56
$3.60
$47.78
$0.52
$2.05
$0.41
$75.19
$2.56
7
Trinidad and Tobago
$252.42
$188.86
$0.00
$22.13
$5.17
$0.00
$0.00
$36.25
$0.00
8
Saudi Arabia
$243.66
$200.86
$0.00
$10.15
$26.94
$0.20
$0.44
$2.26
$2.82
9
South Africa
$190.11
$9.82
$0.16
$125.50
$0.09
$0.02
$0.01
$48.07
$6.44
10
Colombia
$183.95
$178.42
$0.42
$2.45
$0.29
$0.54
$0.37
$1.39
$0.08
11
Russia
$180.01
$0.03
$0.00
$42.23
$98.65
$0.04
$0.00
$37.49
$1.57
12
Qatar
$176.39
$145.51
$0.00
$4.52
$24.78
$0.00
$0.00
$0.03
$1.54
13
Algeria
$129.20
$73.85
$0.00
$0.21
$7.10
$0.00
$2.04
$46.00
$0.00
14
Iraq
$125.41
$125.41
$0.00
$0.00
$0.00
$0.00
$0.00
$0.00
$0.00
15
Venezuela
$109.76
$107.69
$0.00
$1.70
$0.00
$0.02
$0.00
$0.00
$0.36
16
Ukraine
$104.32
$0.07
$0.09
$1.75
$0.01
$0.04
$0.00
$102.36
$0.01
17
Turkey
$71.61
$31.66
$0.45
$11.81
$0.02
$2.14
$11.79
$10.50
$3.23
18
Taiwan
$62.33
$22.81
$0.27
$23.24
$0.42
$3.43
$0.43
$11.49
$0.14
19
Ecuador
$56.53
$54.29
$0.00
$0.01
$0.00
$0.02
$0.01
$0.00
$2.20
20
Brunei
$55.23
$0.00
$0.00
$54.91
$0.00
$0.00
$0.00
$0.32
$0.00
As can be seen, Canada is not included in Table 3, as, while U.S.-Canada trade in BCA goods in substantial, Canada has had a national carbon price in place since 2019, appearing as USD $58.94 in our model, the average price in 2024. For this reason, Canada’s BCA estimate is $0 in our $55 carbon price scenarios. This presents an interesting case study for how a U.S. BCA might affect trading partners’ decision functions regarding a domestic carbon price. In March 2025, the government of Canada announced that it is removing the requirement for provinces and territories to have a consumer-facing carbon price (Government of Canada, 2025). If Canada’s carbon price were eliminated, Canadian exporters would be severely affected by a U.S. BCA given the high volume of trade between the United States and Canada. In 2023, the customs value of Canadian exports to the United States in BCA-covered sectors totaled $160.0 billion, far eclipsing second-place Mexico, which exported $34.6 billion in BCA-covered goods to the United States. At a carbon price of $55 per ton, under Scenario 2, where only emissions above a U.S. benchmark are taxed, Canada would face $409 million in BCA dues. Under Scenario 3, where all emissions are taxed, Canada would be subject to $2.7 billion of BCA fees. Canada would surpass Mexico – which faces a BCA bill of $1.0 billion under Scenario 2 and $1.9 billion under Scenario 3 – as the worst-hit exporter to the United States.
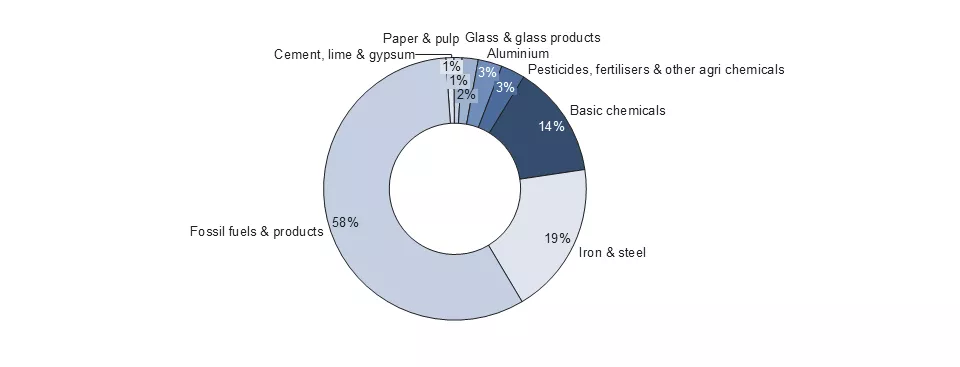
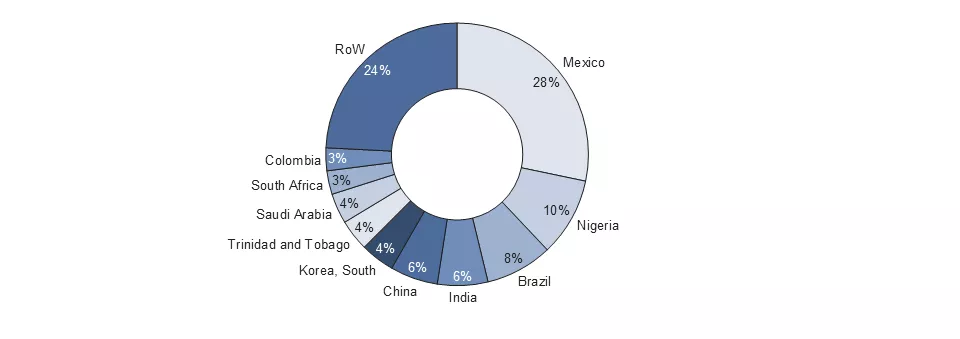
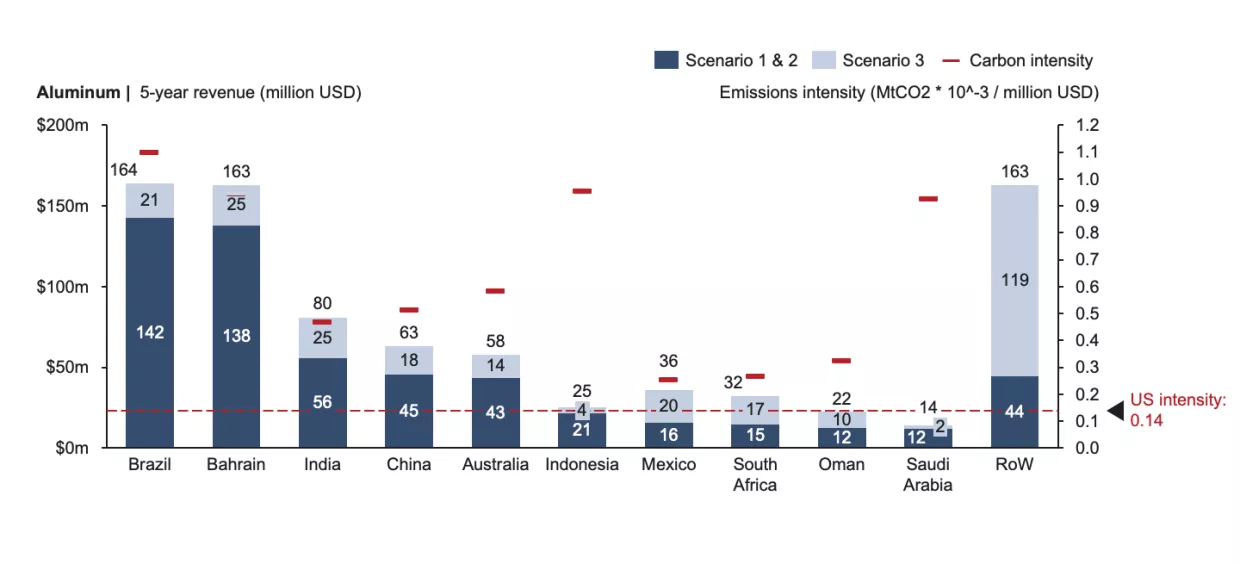
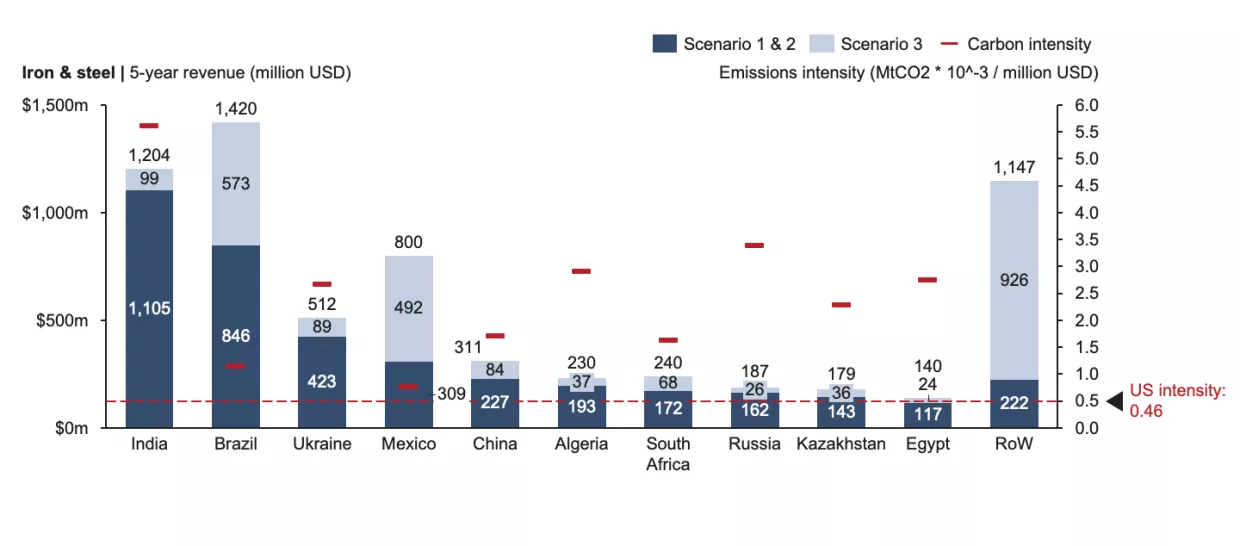
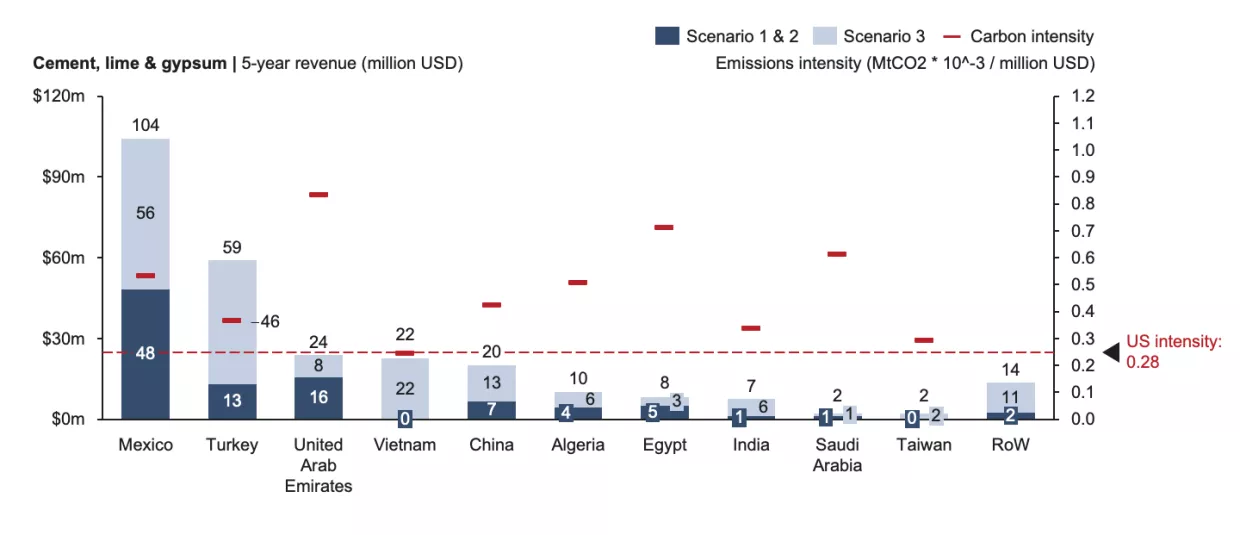
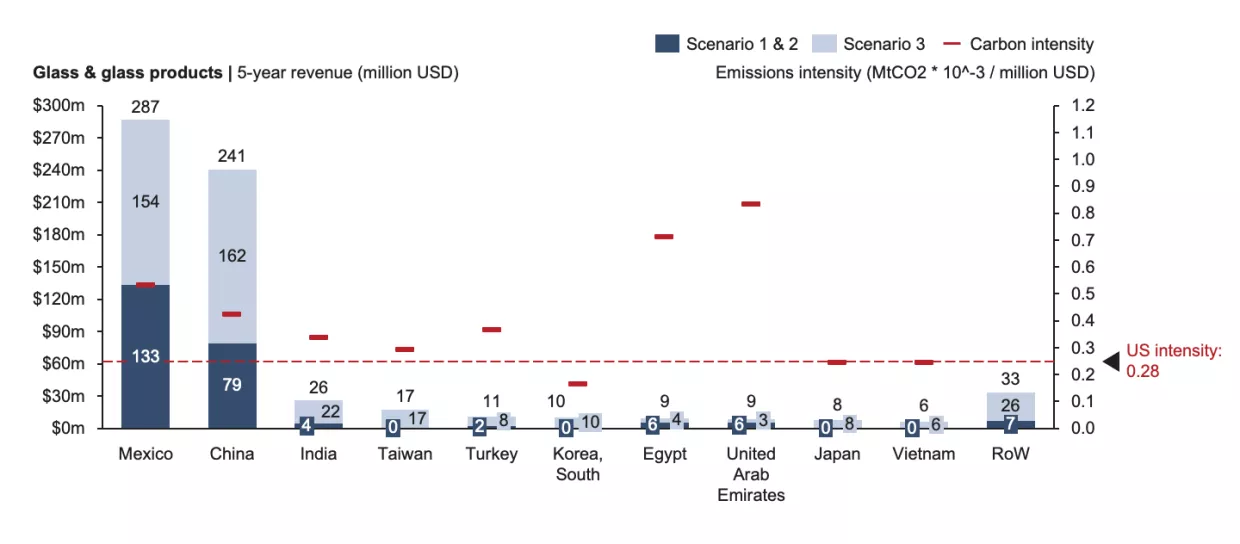
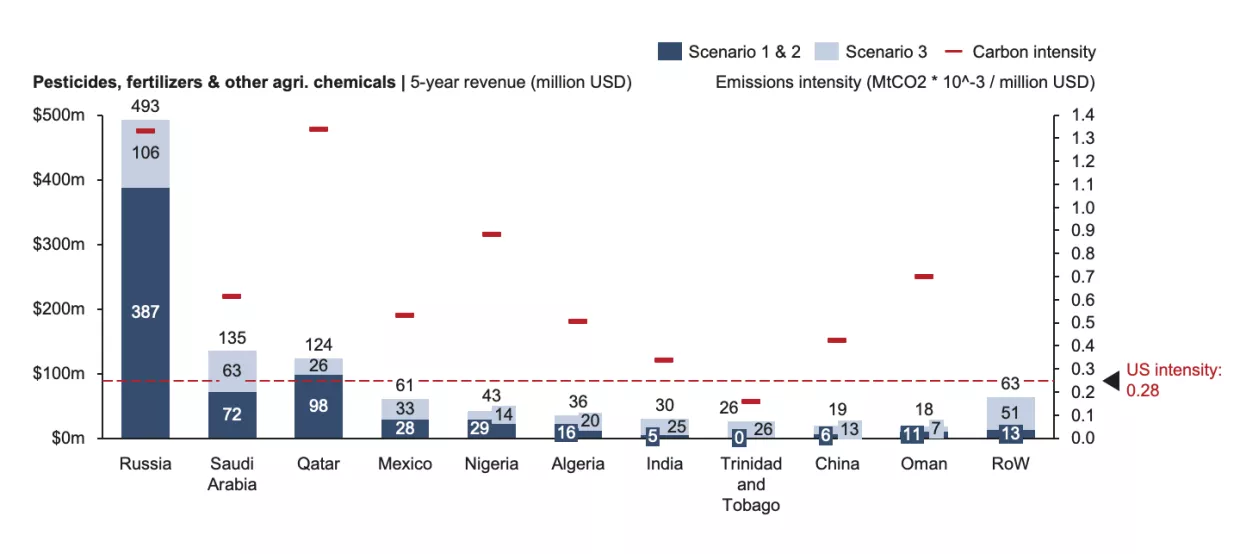
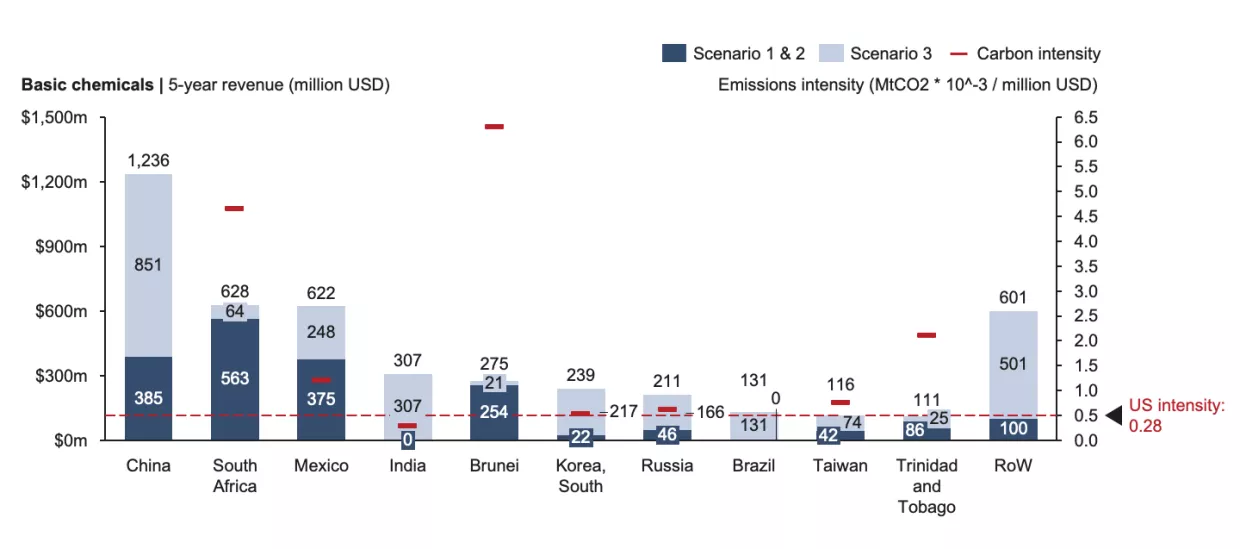
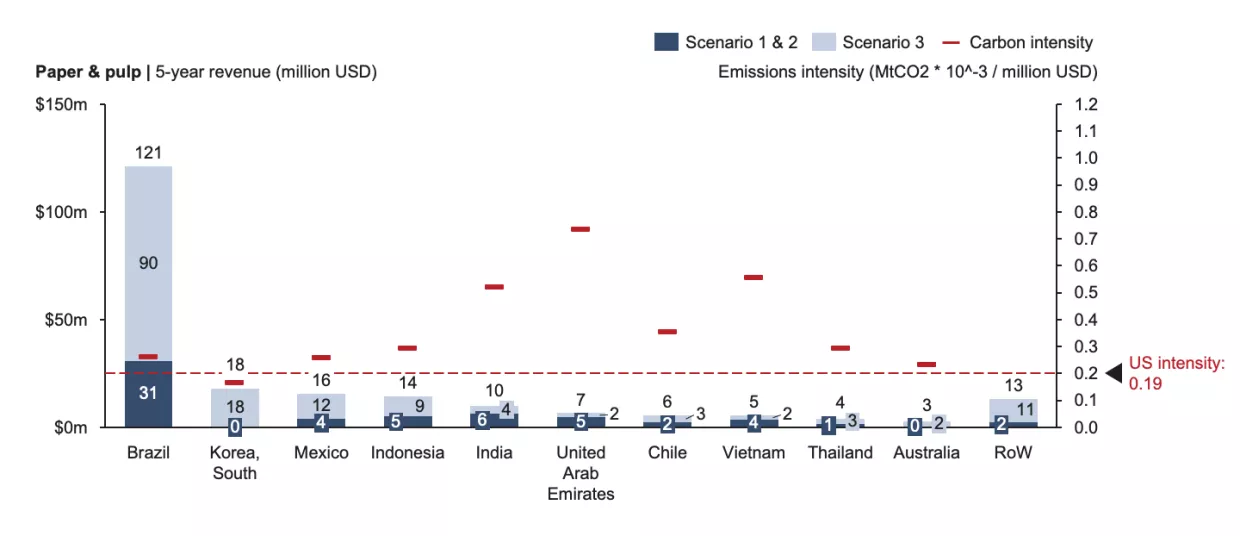
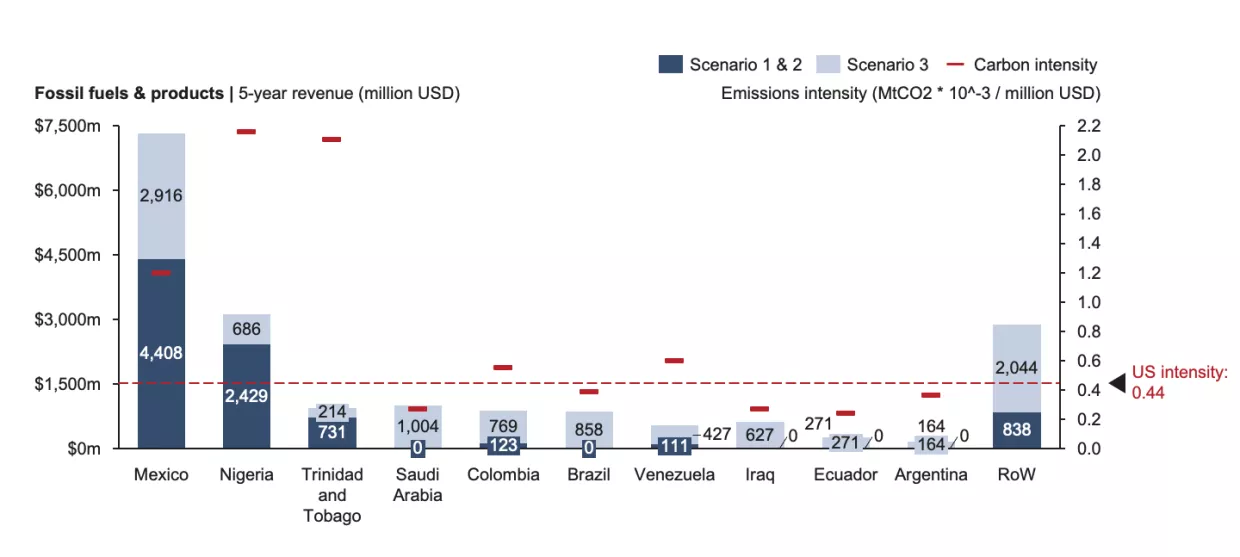
Overall, the breakdown of BCA revenue by country and by good is shown in Figure 1:
Ely Sandler, Christine Jiang, Daniel Schrag
Figure 1.1. Share of BCA Revenue by Sector.
Ely Sandler, Christine Jiang, Daniel Schrag
Figure 1.2. Share of BCA revenue by geography (top 10 exporters).
To understand the potential impact of a U.S. BCA on America’s trading partners on a systematic level, we have categorized exporters into five groups:
Heavily affected fossil fuels exporters – countries with BCA payments exceeding $100 million in Year 1, for which fossil fuels drive one third or more;
Heavily affected other goods exporter – all other countries with BCA payments exceeding $100 million in Year 1;
Moderately affected exporters - countries with BCA payments between $10 million to $100 million in Year 1;
Less affected exporters - countries with BCA payments less than $10 million in Year 1;
Unaffected exporters – countries with high domestic carbon prices leading to nil BCA payments
The breakdown of countries into these four groups is presented in Table 4 below. In addition, Appendix I shows the full potential BCA revenue by country and good.
Table 4 - Groupings of Country Exposure to a U.S. BCA
(1) Heavily affected fossil fuels exporters
(2) Heavily affected other goods exporters
(3) Moderately affected exporters
(4) Less-affected exporters
(5) Unaffected exporters
Mexico Nigeria South Korea Trinidad and Tobago Saudi Arabia Colombia Qatar Algeria Iraq Venezuela
Brazil India China South Africa Russia Ukraine
Turkey Taiwan Ecuador Brunei Argentina Kazakhstan Indonesia Bahrain United Arab Emirates Egypt Japan Chile United Kingdom Australia Oman Vietnam Malaysia Singapore Thailand Israel
Kuwait Georgia Guatemala Philippines Peru Equatorial Guinea Zimbabwe Tunisia Ghana New Zealand Serbia Azerbaijan Jordan Pakistan Morocco Dominican Republic Honduras Mozambique Costa Rica Cambodia Paraguay Belarus Cameroon Cote d'Ivoire El Salvador Bangladesh Albania Lebanon Gabon Hong Kong Zambia Panama Kenya Jamaica Uzbekistan Sri Lanka Bolivia Nicaragua Nepal Mongolia Kyrgyzstan Haiti Tanzania West Bank Eswatini Mali Ethiopia Niger Armenia Iran Namibia Senegal
Austria Belgium Bulgaria Canada Croatia Cyprus Czech Republic Denmark Estonia Finland France Germany Greece Hungary Ireland Italy Latvia Lithuania Luxembourg Malta Netherlands Norway Poland Portugal Romania Slovakia Slovenia Spain Sweden Switzerland Uruguay
As a secondary measure of country exposure, we have also created an index to understand how affected countries are as a proportion of overall exports. This gives a measure of the political salience – and potential negative economic impact – of a U.S. BCA. In Appendix II, we show a ranked list of countries by the proportion of exports that may be subject to a U.S. BCA, under the sectoral coverage of the CCA. For this analysis, we assume that no country can net off an effective carbon price paid and instead consider strictly the share of exports that are sent to the United States and are in-scope for the CCA. The top 10 countries in this BCA exposure index are mostly fossil-intensive developing economies, such as Nigeria, Algeria, and Colombia. Portugal and Canada also feature in the 8th and 10th place respectively, due to their relatively high share of petroleum exports to the United States.
Foreign Pollution Fee Act
The revenue-generating potential of trade partners under the FPFA differs greatly from their revenue potential under the CCA, due to the design of the FPFA as an ad valorem tax without any deductions for the local carbon prices paid. Here, a country’s potential liability under the FPFA is purely a function of the volume of exports to the United States and its relative carbon intensity. In Table 5 below, we present the 20 countries that would be most affected by the FPFA, with values presented being the annual liability based on the tiered fee schedule. The top 4 revenue generators – Canada, Mexico, Brazil, and China – represent the top 4 import partners, in the same order, for the covered goods.
Table 5 - FPFA Annual Revenue for Top 20 Countries
(In million USD)
Total
Fertilizers
Glass
Cement
Iron & steel
Aluminum
Hydrogen
Solar products
Battery inputs
1
Canada
$11,105.41
$382.81
$31.25
$58.79
$3,528.76
$6,805.11
$2.44
$30.18
$266.06
2
Mexico
$3,796.59
$205.47
$964.52
$350.90
$1,601.90
$236.22
$0.00
$119.03
$318.56
3
Brazil
$3,453.18
$1.40
$2.01
$0.65
$2,893.43
$542.64
$0.00
$4.20
$8.85
4
China
$3,391.18
$71.19
$904.41
$75.20
$859.79
$582.67
$0.02
$771.76
$126.15
5
Russia
$1,596.55
$1,350.97
$0.49
$0.00
$201.53
$43.56
$0.00
$0.00
$0.00
6
India
$1,565.33
$70.04
$60.56
$17.34
$781.23
$627.00
$0.00
$5.75
$3.41
7
Vietnam
$960.13
$0.96
$4.54
$16.65
$26.71
$7.60
$0.00
$897.03
$6.64
8
South Africa
$908.41
$1.73
$0.32
$0.21
$659.96
$241.71
$0.00
$1.53
$2.95
9
Australia
$833.14
$5.00
$0.50
$0.01
$18.60
$601.55
$0.00
$4.01
$203.48
10
Ukraine
$711.40
$0.23
$0.75
$0.06
$709.62
$0.20
$0.06
$0.13
$0.35
11
Taiwan
$679.26
$1.57
$12.79
$1.61
$50.90
$3.47
$0.03
$580.44
$28.45
12
Bahrain
$641.58
$0.83
$1.11
$0.00
$0.01
$639.49
$0.00
$0.04
$0.10
13
Saudi Arabia
$514.27
$431.81
$3.25
$7.02
$4.71
$55.45
$0.00
$1.91
$10.13
14
Thailand
$505.86
$0.68
$2.49
$1.92
$24.85
$8.12
$0.01
$466.61
$1.18
15
Malaysia
$479.20
$0.05
$3.90
$0.93
$20.01
$39.84
$0.00
$401.97
$12.49
16
South Korea
$456.05
$3.28
$12.91
$2.61
$168.23
$24.94
$0.00
$211.42
$32.67
17
Algeria
$428.54
$108.77
$0.03
$31.25
$288.48
$0.00
$0.00
$0.02
$0.00
18
Japan
$416.82
$2.87
$17.92
$0.05
$97.13
$5.88
$0.00
$292.97
$0.00
19
Trinidad and Tobago
$400.75
$30.00
$0.00
$0.00
$370.14
$0.00
$0.02
$0.31
$0.28
20
Qatar
$352.01
$337.14
$0.05
$0.00
$0.13
$13.70
$0.00
$0.18
$0.82
On the whole, 13 of the same countries that appeared in the list of top 20 revenue generators under the CCA also appear on the list for FPFA, with the discrepancy in the FPFA list reflecting the lack of deductions for effective carbon prices (Canada, Australia, Japan) and the different sectoral mix (Vietnam, Bahrain, Thailand, Malaysia).
3.4. U.S. Carbon Intensity
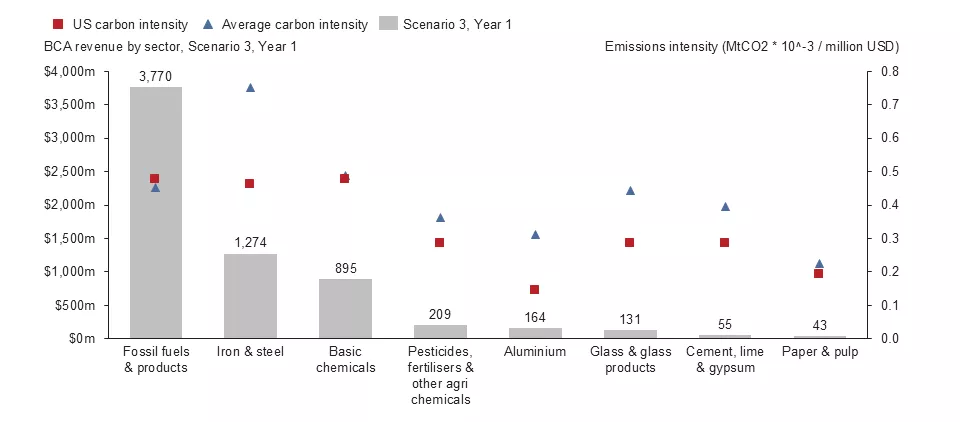
The United States is less carbon-intensive than the large majority of its imports, with the exception of fossil fuels and related products. This creates a potential American “carbon advantage,” which could ultimately increase the competitiveness of U.S. goods and decrease the trade deficit (Rorke and Bertelsen, 2020).
In the paper sector, U.S. production is less carbon-intensive than 86% of its imports by value. U.S. fertilizers are 79% less carbon-intensive than imports. In the aluminum sector, the U.S. industry average is less carbon-intensive than 80% of imported aluminum by value. In the cement sector, the United States is less carbon-intensive than 72% of imports. In the glass sector, the figure stands at 66%; in iron and steel, the figure stands at 60%. The lowest carbon advantage comes in chemicals and fossil fuel products. These results are shown in Figure 2.
Ely Sandler, Christine Jiang, Daniel Schrag
Figure 2. U.S. Carbon Intensity Relative to U.S. Imports.
4. Discussion
4.1. The Revenue and Competitiveness Opportunities of a U.S. BCA
Based on our results, we identify two key points of political salience for the policy debate within the United States. First, we identify a revenue opportunity, as depending on design, an upper-bound estimate shows that a BCA could generate up to $85.5 billion or even $198.1 billion over a five-year period, providing fiscal space for government priorities. This represents a significant new external revenue source, especially when compared to the $77 billion raised from tariffs in 2024 (Congressional Research Service, 2025). BCA revenue could serve as a major funding stream for the External Revenue Service, a Trump administration proposal aimed at consolidating the collection of tariffs, duties, and other trade-related revenues (The White House, 2025).
While revenue generation in and of itself is a potential motivator for a BCA, existing literature identifies three primary uses for BCA funds which could support wider government goals: energy infrastructure investment, support for communities affected by the energy transition, and general government expenditure (Mehling and Svensson, 2024). During the EU CBAM legislative process, for example, proposals for use-of-proceeds included clean energy investment and support for affected communities, although revenue is now expected to fund the NextGenerationEU pandemic recovery package, i.e. general government spending.
At present, the CCA allocates BCA revenue to competitive grants for industrial decarbonization and multilateral climate assistance, while the MCA directs funds to infrastructure, climate resilience, and mitigation technology R&D. The FPFA, by contrast, does not specify a use for revenue. These dynamics suggest that the fiscal opportunity of a U.S. BCA, if implemented efficiently, could garner significant government support agnostic of specific partisan views on its climate impact.
Our second politically salient finding is a competitiveness opportunity, as U.S. goods are significantly less carbon-intensive than those of its trading partners. This finding aligns with Rorke and Bertelsen (2020), who find that U.S. goods are twice as carbon-efficient versus foreign experts in energy extraction, rubber, and plastics. This comparatively low carbon-intensity extends to other BCA goods such as steel, chemicals, cement, and glass, largely because of abundant American domestic natural gas, which is used in manufacturing instead of coal (Schivley, Azevedo and Samaras, 2018). The competitiveness of U.S. production holds less true in fossil fuels and associated products such as petrochemicals, likely due the hydraulic fracturing technology used to extract oil from shale.
America’s lower carbon intensity is significant because it suggests that a U.S. BCA could enhance the competitiveness of U.S. goods in a “carbon tax world,” i.e., one where a large share of global trade is subject to carbon pricing. While estimating trade effects is beyond this paper’s scope, analyses of the EU CBAM indicate that such policies can boost net exports for lower-emission economies (Clausing et al., 2024). Though a BCA may also raise import costs, its potential to improve the relative attractiveness of U.S. goods could support broader policy goals, such as reducing the trade deficit and expanding domestic manufacturing in sectors covered by carbon pricing.
It is worth noting our interpretation of U.S. carbon intensity differs from Pomerleau (2023), who argues that the competitive advantage for U.S. firms in this regard has been overstated. While Pomerleau’s methodology varies slightly from ours, mixing EORA data for carbon intensity with GTAP for trade volumes, whereas we calculate a GTAP carbon intensity index, her data in fact broadly align with our results. The difference in our conclusions is therefore instead attributable to her emphasis on overall carbon intensity versus that of specific U.S. trading partners. While the United States, according to both our estimates and those of Pomerleau, is only slightly below average in carbon intensity for all goods produced worldwide, we disagree that this undermines the notion of an American carbon advantage. Both our results and those of Pomerleau show the United States to be significantly less carbon intensive than its actual trading partners in BCA goods. These include geographically proximate countries (e.g., Mexico and Canada) and large low- and middle-income countries that have traditionally competed with the United States on manufacturing (e.g., India and China). This suggests that while a BCA would not necessarily present an advantage over developed markets such as the EU and the UK, it remains an impactful policy for competitiveness within more salient trading relationships, where a competitiveness boost is in any case more needed.
4.2. Pairing the U.S. BCA with a Domestic Carbon Price
A key question that arises in parallel to the U.S. BCA is whether to pair the policy with a domestic carbon price. While politically contentious, we argue that our results show compelling reasons why to do so, as is currently the case in the MCA and CCA, though not explicitly the FPFA.
First, a domestic carbon price would dramatically increase overall carbon revenue, as well as spur domestic decarbonization. For BCA revenue itself, imposing a domestic carbon price would allow all emissions - not just those exceeding the U.S. average - to be taxed. This is shown in the difference between Scenario 2 and Scenario 3 in our CCA analysis, which shows a five-year revenue of up to $50 billion, depending on the carbon price. Outside the BCA itself, a domestic carbon price would also ensure that, as more foreign jurisdictions like the EU and UK implement BCAs, U.S. firms do not end up paying foreign tariffs such as CBAMs.
Second, implementing a domestic carbon price could enhance U.S. trade competitiveness over the long term. It would send a clear signal to American firms to begin decarbonizing, giving them an early-mover advantage as more jurisdictions adopt carbon pricing. U.S. firms may be particularly well-positioned to decarbonize, given the country’s relatively low cost of capital, high levels of innovation, and extensive natural gas infrastructure. Empirical evidence suggests that the United States is already well positioned in this regard, and carbon pricing regimes increase clean innovation, and countries with higher R&D capacity - such as the United States - experience greater marginal gains (Popp, 2019) .
Third, a domestic carbon price would improve the legitimacy and international acceptance of a U.S. BCA. Without a domestic carbon price, the United States risks accusations of protectionism, which could invite retaliatory tariffs. A well-accepted BCA, based on a domestic price, would therefore minimize trade disputes that could otherwise reduce trade volumes and undermine revenue generation, as well as potentially increase prices in the United States.
Finally, the eventual opportunity cost of not implementing a domestic carbon price may be substantial in the long term. In a global economy moving toward carbon pricing, U.S. firms risk falling behind if others decarbonize and American firms do not. Firms in Europe and parts of Asia already face rising carbon prices and are adapting accordingly. If the United States delays implementing its own carbon price, it may forgo both the competitive and fiscal benefits, while allowing foreign firms to capture emerging markets for low-carbon goods.
4.3. Comparing the FPFA versus CCA
Calculating the FPFA Implicit Carbon Price
Given that we find the revenue potential of the FPFA to be significantly larger than the CCA or MCA, it is worth considering how these proposals would equate when compared directly, i.e., when the FPFA is evaluated on the basis of carbon price, rather than an ad valorem tariff. Calculating such an implied carbon price will help explain the stark difference in revenue expectations.
To calculate the FPFA implicit carbon price, we can modify our Scenario 4 to consider only the products that are in-scope for both the FPFA and the CCA, i.e., those for which we have emissions data available, and the FPFA. Under this more limited set of goods, the FPFA would generate $32 billion under the tiered fee schedule. If we divide this figure by the emissions in this overlapping set of products that exceeds the U.S. average intensity, we arrive at an implied carbon price for the FPFA of $1,200/tCO2. While this is only a back-of-the-envelope calculation, i.e., total BCA tax bill divided by total taxed emissions, it becomes clear why the revenue of the FPFA is so much higher.
Allowing the Deduction of Effective Carbon Prices
Apart from the carbon price vs ad valorem difference, another significant departure between the FPFA and the CCA is the deduction of ECPs. While the CCA and MCA explicitly allow U.S. trading partners to deduct local carbon prices, the FPFA does not. Instead, the FPFA currently makes a more general provision for a reduction in the fee for goods produced in a country that is “party to an international partnership agreement” (Section 4695, s.1325, 119th Congress, 2025).
We recommend that the FPFA explicitly allow deductions for local ECPs, in addition to the existing provision for international partnership agreements. This adjustment is essential for the BCA’s international credibility and mirrors the rationale discussed in Section 4.2 regarding the benefits of a domestic U.S. carbon price. Without a provision for foreign carbon prices, the FPFA risks being seen as protectionist and may invite legal and diplomatic challenges, which could ultimately disrupt trade and undermine the policy’s benefits. Given the extremely high implicit carbon price under the FPFA - approximately $1,200 per ton of CO2, far above any global domestic price - permitting ECP deductions would have only a modest impact on revenue. For example, among goods covered by both the FPFA and the CCA, allowing for local carbon price deductions would reduce revenue by just $405 million.
4.2. Conclusion and Next Steps
The findings of this paper have highlighted the substantial revenue potential of a U.S. BCA, potentially providing a new funding stream for federal priorities. A U.S. BCA could also reinforce U.S. competitiveness in a world where carbon pricing is becoming more widespread. These conclusions underscore the importance of careful policy design - including pairing the BCA with a domestic carbon price and allowing for deductions of foreign ECPs. If implemented effectively, a U.S. BCA could not only mitigate carbon leakage and protect domestic industries but also encourage broader global adoption of carbon pricing, reinforcing the U.S. carbon advantage.
Several critical next steps are needed to refine and implement an effective BCA. First, more detailed data collection and emissions intensity reporting are essential to ensure accurate tariff calculations, as outlined in the PROVE IT Act. Second, further research is required to assess the full trade implications of a BCA, particularly its effects on export competitiveness, supply chains, and global trade flows. Third, further economic analysis is needed to understand the economy-wide effects of a BCA, to predict the tax’s incidence, strategic responses from firms, and sectoral shifts to reallocate labor and capital towards less carbon-intensive industries. Fourth, diplomatic engagement will be key in managing potential trade tensions and securing international acceptance, particularly with major trading partners. Finally, policymakers must determine the best use of BCA revenue, balancing domestic reinvestment, industrial decarbonization, and general government spending.
Appendix I
Annual BCA Revenue (Year 1), Scenario 3, $55/tCO2, countries generating over $1.0m
Rank
Country
Total
Fossil fuels
Paper & pulp
Chemicals
Fertilizers
Glass
Cement, lime & gypsum
Iron & steel
Aluminum
1
Mexico
$1,850.00m
$1,464.70m
$3.14m
$124.46m
$12.21m
$57.34
$20.86m
$160.09m
$7.20m
2
Nigeria
$633.64m
$623.11m
$0.00m
$2.00m
$8.53m
$0.00m
$0.00m
$0.00m
$0.00m
3
Brazil
$539.64m
$171.65m
$24.24m
$26.15m
$0.31m
$0.45m
$0.14m
$283.92m
$32.77m
4
India
$406.09m
$73.22m
$1.97m
$61.47m
$5.98m
$5.17m
$1.48m
$240.72m
$16.09m
5
China
$384.68m
$6.38m
$0.39m
$247.21m
$3.79m
$48.13
$4.00m
$62.17m
$12.60m
6
South Korea
$274.68m
$142.56m
$3.60m
$47.78m
$0.52m
$2.05m
$0.41m
$75.19
$2.56m
7
Trinidad and Tobago
$252.42m
$188.86m
$0.00m
$22.13m
$5.17m
$0.00m
$0.00m
$36.25m
$0.00m
8
Saudi Arabia
$243.66m
$200.86m
$0.00m
$10.15m
$26.94m
$0.20m
$0.44m
$2.26m
$2.82m
9
South Africa
$190.11m
$9.82m
$0.16m
$125.50m
$0.09m
$0.02m
$0.01m
$48.07m
$6.44m
10
Colombia
$183.95m
$178.42m
$0.42m
$2.45m
$0.29m
$0.54m
$0.37m
$1.39m
$0.08
11
Russia
$180.01m
$0.03m
$0.00m
$42.23m
$98.65m
$0.04m
$0.00m
$37.49m
$1.57m
12
Qatar
$176.39m
$145.51m
$0.00m
$4.52m
$24.78m
$0.00m
$0.00m
$0.03m
$1.54m
13
Algeria
$129.20m
$73.85m
$0.00m
$0.21m
$7.10m
$0.00m
$2.04m
$46.00m
$0.00m
14
Iraq
$125.41m
$125.41m
$0.00m
$0.00m
$0.00m
$0.00m
$0.00m
$0.00m
$0.00m
15
Venezuela
$109.76m
$107.69m
$0.00m
$1.70m
$0.00m
$0.02m
$0.00m
$0.00m
$0.36m
16
Ukraine
$104.32m
$0.07m
$0.09m
$1.75m
$0.01m
$0.04m
$0.00m
$102.36m
$0.01m
17
Turkey
$71.61m
$31.66m
$0.45m
$11.81m
$0.02m
$2.14m
$11.79m
$10.50m
$3.23m
18
Taiwan
$62.33m
$22.81m
$0.27m
$23.24m
$0.42m
$3.43m
$0.43m
$11.59m
$0.14m
19
Ecuador
$56.53m
$54.29m
$0.00m
$0.01m
$0.00m
$0.02m
$0.01m
$0.00m
$2.20m
20
Brunei
$55.23m
$0.00m
$0.00m
$54.91m
$0.00m
$0.00m
$0.00m
$0.32m
$0.00m
21
Argentina
$52.34m
$32.76m
$0.02m
$2.87m
$0.02m
$0.00m
$0.00m
$10.90m
$5.77m
22
Kazakhstan
$46.26m
$10.07m
$0.00m
$0.39m
$0.00m
$0.00m
$0.00m
$35.80m
$0.00m
23
Indonesia
$45.95m
$8.06m
$2.88m
$20.39m
$1.03m
$0.96m
$0.30m
$7.34m
$5.00m
24
Bahrain
$38.04m
$4.84m
$0.00m
$0.00m
$0.26m
$0.35m
$0.00m
$0.00m
$32.59m
25
United Arab Emirates
$35.09m
$8.15m
$1.33m
$0.44m
$0.00m
$1.70m
$4.75m
$9.08m
$9.64m
26
Egypt
$34.71m
$0.20m
$0.07m
$0.02m
$2.82m
$1.86m
$1.62m
$28.07m
$0.06m
27
Japan
$31.52m
$4.40m
$0.16m
$14.42m
$0.25m
$1.57m
$0.00m
$10.56m
$0.15m
28
Chile
$29.76m
$9.65m
$1.10m
$13.08m
$0.44m
$0.28m
$0.00m
$5.22m
$0.00m
29
United Kingdom
$29.03
$17.94m
$0.06m
$9.57m
$0.11m
$0.13m
$0.01m
$1.16m
$0.06m
30
Australia
$24.07m
$2.35m
$0.51m
$5.19m
$0.90m
$0.09m
$0.00m
$3.46m
$11.56m
31
Oman
$23.56m
$11.52m
$0.00m
$2.51m
$3.57m
$0.16m
$0.05m
$1.28m
$4.47m
32
Vietnam
$21.44m
$0.00m
$1.09m
$0.05m
$0.26m
$1.22m
$4.48m
$13.51m
$0.83m
33
Malaysia
$17.61m
$4.39m
$0.27m
$3.24m
$0.01m
$1.07m
$0.26m
$7.13m
$1.24m
34
Singapore
$14.46m
$11.86m
$0.00m
$2.09m
$0.00m
$0.44m
$0.00m
$0.05m
$0.01m
35
Thailand
$13.61m
$0.05m
$0.78m
$1.19m
$0.10m
$0.37m
$0.29m
$9.87m
$0.51m
36
Israel
$11.93m
$3.72m
$0.07m
$6.20m
$1.84m
$0.03m
$0.04m
$0.00m
$0.04m
37
Kuwait
$7.63m
$7.58m
$0.00m
$0.05m
$0.00m
$0.00m
$0.00m
$0.00m
$0.00m
38
Georgia
$6.36m
$0.00m
$0.00m
$0.00m
$0.00m
$0.00m
$0.00m
$6.36m
$0.00m
39
Guatemala
$4.15m
$3.83m
$0.00m
$0.04m
$0.01m
$0.01m
$0.00m
$0.26m
$0.00m
40
Philippines
$3.35m
$0.12m
$0.10m
$0.79m
$0.00m
$0.02m
$0.07m
$2.24m
$0.00m
41
Peru
$3.05m
$2.38m
$0.00m
$0.24m
$0.02m
$0.41m
$0.00m
$0.01m
$0.00m
42
Equatorial Guinea
$2.34m
$2.17m
$0.00m
$0.17m
$0.00m
$0.00m
$0.00m
$0.00m
$0.00m
43
Zimbabwe
$2.28m
$0.00m
$0.00m
$0.00m
$0.00m
$0.00m
$0.00m
$2.28m
$0.00m
44
Tunisia
$1.93m
$0.08m
$0.00m
$0.03m
$1.62m
$0.00m
$0.20m
$0.00m
$0.00m
45
Ghana
$1.74m
$1.74m
$0.00m
$0.00m
$0.00m
$0.00m
$0.00m
$0.00m
$0.00m
46
New Zealand
$1.52m
$0.00m
$0.01m
$0.90m
$0.01m
$0.01m
$0.00m
$0.07m
$0.53m
47
Serbia
$1.12m
$0.47m
$0.00m
$0.04m
$0.00m
$0.55m
$0.00m
$0.07m
$0.00m
48
Azerbaijan
$1.08m
$0.42m
$0.00m
$0.00m
$0.00m
$0.00m
$0.00m
$0.00m
$0.66m
Appendix II
U.S. BCA Exposure, ranked by share of exports in goods subject to a U.S. BCA2 (The World Factbook)
Rank
Country
Value of exports subject to U.S. BCA
Potential U.S. BCA liability (no netting off) as share of all exports in goods
1
Nigeria
$5,439m
2.187%
2
Algeria
$3,018m
1.051%
3
Zimbabwe
$60m
0.477%
4
Brunei
$177m
0.386%
5
South Africa
$1,910m
0.309%
6
Colombia
$7,356m
0.307%
7
Ecuador
$4,172m
0.220%
8
Portugal
$1,289m
0.207%
9
Chile
$1,572m
0.187%
10
Canada
$159,992m
0.163%
11
Iraq
$8,464m
0.139%
12
Guatemala
$63m
0.137%
13
Saudi Arabia
$15,311m
0.132%
14
Ukraine
$774m
0.116%
15
Kazakhstan
$1,607m
0.094%
16
Bahrain
$829m
0.066%
17
Finland
$2,503m
0.064%
18
Georgia
$67m
0.055%
19
Turkey
$2,264m
0.053%
20
South Korea
$12,156m
0.052%
21
Sweden
$2,033m
0.051%
22
Slovenia
$144m
0.042%
23
Equatorial Guinea
$284m
0.040%
24
Israel
$1,081m
0.039%
25
Venezuela
$3,326m
0.038%
26
Spain
$4,019m
0.036%
27
Lithuania
$947m
0.031%
28
France
$4,976m
0.030%
29
China
$13,247m
0.026%
30
Oman
$793m
0.026%
31
Denmark
$685m
0.024%
32
Greece
$486m
0.020%
33
United Arab Emirates
$3,351m
0.019%
34
Australia
$1,292m
0.018%
35
Pakistan
$53m
0.017%
36
Romania
$453m
0.017%
37
Mozambique
$6m
0.016%
38
Ghana
$1,202m
0.015%
39
Hungary
$143m
0.014%
40
Norway
$1,847m
0.013%
41
Vietnam
$1,259m
0.012%
42
Austria
$1,220m
0.011%
43
Jordan
$120m
0.011%
44
Ireland
$8,991m
0.010%
45
Switzerland
$3,532m
0.010%
46
Netherlands
$6,848m
0.010%
47
Kuwait
$1,618m
0.010%
48
Tunisia
$129m
0.010%
49
Belgium
$3,262m
0.009%
50
Poland
$448m
0.009%
51
Thailand
$1,218m
0.008%
52
Uruguay
$101m
0.008%
53
Russia
$2,863m
0.008%
54
Japan
$5,731m
0.008%
55
Estonia
$37m
0.007%
56
Azerbaijan
$45m
0.007%
57
Qatar
$1,931m
0.007%
58
Honduras
$40m
0.006%
59
Morocco
$233m
0.006%
60
Czech Republic
$347m
0.006%
61
Singapore
$2,064m
0.006%
62
Philippines
$197m
0.006%
63
Eswatini
$0m
0.005%
64
Bulgaria
$146m
0.004%
65
Indonesia
$1,389m
0.004%
66
Lebanon
$11m
0.004%
67
Serbia
$30m
0.004%
68
Albania
$6m
0.004%
69
Cote d'Ivoire
$47m
0.003%
70
Luxembourg
$254m
0.003%
71
Uzbekistan
$3m
0.003%
72
Malaysia
$1,326m
0.003%
73
El Salvador
$11m
0.003%
74
Haiti
$0m
0.003%
75
Slovakia
$56m
0.002%
76
Croatia
$24m
0.002%
77
New Zealand
$163m
0.002%
78
Bolivia
$11m
0.002%
79
Jamaica
$66m
0.002%
80
Nepal
$0m
0.002%
81
Mongolia
$0m
0.002%
82
Nicaragua
$1m
0.002%
83
Armenia
$1m
0.002%
84
Cameroon
$47m
0.001%
85
Namibia
$0m
0.001%
86
Paraguay
$20m
0.001%
87
Tanzania
$0m
0.001%
88
Latvia
$25m
0.001%
89
Mali
$0m
0.001%
90
Libya
$1,535m
0.001%
91
Angola
$1,025m
0.001%
92
Gabon
$3m
0.001%
93
Liechtenstein
$31m
0.001%
Appendix III
Top BCA Revenue Trading Partners & U.S. Carbon Intensity
Ely Sandler, Christine Jiang, Daniel Schrag
Figure 3. Carbon intensity and 5-year revenue potential of top 10 aluminum exporters.
Ely Sandler, Christine Jiang, Daniel Schrag
Figure 4. Carbon intensity and five-year revenue potential of top 10 iron and steel exporters.
Ely Sandler, Christine Jiang, Daniel Schrag
Figure 5. Carbon intensity and 5-year revenue potential of top 10 cement exporters.
Ely Sandler, Christine Jiang, Daniel Schrag
Figure 6. Carbon intensity and 5-year revenue potential of top 10 glass exporters.
Ely Sandler, Christine Jiang, Daniel Schrag
Figure 7. Carbon intensity and 5-year revenue potential of top 10 fertilizer exporters.
Ely Sandler, Christine Jiang, Daniel Schrag
Figure 8. Carbon intensity and five-year revenue potential of top 10 chemical exporters.
Ely Sandler, Christine Jiang, Daniel Schrag
Figure 9. Carbon intensity and five-year revenue potential for top 10 paper exporters.
Ely Sandler, Christine Jiang, Daniel Schrag
Figure 10. Carbon intensity and five-year revenue potential of top 10 fossil fuel exporters.
Appendix IV
FPFA covered product / Country of origin
Paragraph (4) or (5) of section 4696
Paragraph (4) or (5) of section 4696
Paragraph (2) of section 4696
Paragraph (3), (6), or (8) of section 4696
Paragraph (7) or (9) of section 4696
Paragraph (10) of section 4696
Paragraph (11) of section 4696
Iron & steel
Aluminum
Articles of aluminum
Cement; glass
Fertilizer; hydrogen
Solar products
Battery inputs
Canada
26%
27%
17%
27%
33%
30%
31%
China
200%
143%
200%
103%
121%
200%
200%
Mexico
38%
27%
45%
0%
0%
100%
39%
South Korea
47%
49%
44%
58%
0%
100%
35%
Germany
9%
30%
0%
0%
0%
35%
0%
Taiwan
100%
100%
100%
51%
53%
100%
69%
India
100%
100%
100%
100%
38%
100%
46%
Vietnam
200%
200%
200%
200%
200%
200%
200%
Brazil
55%
56%
49%
57%
29%
57%
30%
Japan
29%
29%
29%
34%
0%
37%
0%
Italy
0%
0%
0%
0%
0%
77%
0%
Thailand
65%
38%
72%
26%
23%
100%
28%
Turkey
50%
45%
57%
100%
32%
100%
41%
France
0%
6%
0%
0%
0%
19%
0%
Spain
0%
0%
22%
35%
0%
61%
9%
United Kingdom
0%
28%
0%
0%
0%
37%
0%
Netherlands
26%
27%
0%
0%
11%
34%
7%
Russia
200%
200%
200%
200%
200%
0%
0%
Austria
26%
29%
0%
0%
0%
39%
0%
Colombia
32%
32%
32%
0%
0%
100%
0%
Israel
0%
0%
0%
0%
0%
37%
0%
Hungary
33%
28%
33%
31%
0%
100%
39%
Malaysia
71%
40%
100%
33%
100%
100%
100%
Poland
39%
44%
39%
45%
51%
67%
52%
Cambodia
66%
0%
66%
68%
0%
0%
0%
Any other country
50%
40%
55%
48%
69%
100%
37%
Acknowledgements
The authors would also like to thank the many experts, policymakers and market practitioners who gave their time and expertise in the creation of this paper. These include, but are not limited to (N.B., acknowledgement does not imply endorsement of this paper’s findings or conclusions): Representative Salud Carbajal and Johanna Montiel; Christine Harbin and Jazmin Lucio from the office of Senator Bill Cassidy; Vanessa Chan from the University of Pennsylvania; Gerassimos Thomas and Xavier Vanden Bosch from the EU Commission, Professors Joe Aldy and Jason Furman from Harvard Kennedy School, Professor Catherine Wolfram from MIT; Pierre Leturcq from IEEP, and Mohammed Chahim from the European Parliament.
Recommended citation
Sandler, Ely, Christine Jiang and Daniel Schrag. “The Revenue Potential and Country Exposure of a U.S. Border Carbon Adjustment.” Belfer Center for Science and International Affairs, June 2, 2025
The Revenue Potential and Country Exposure of a U.S. Border Carbon Adjustment
In this article
Footnotes
Firms’ greenhouse gas (GHG) emissions are often categorized into three scopes based on their source. Scope 1 includes direct emissions from sources owned or controlled by the firm such as fuel combustion in company vehicles or industrial processes. Scope 2 covers indirect emissions from purchased electricity, steam, heating, or cooling. Scope 3 encompasses all other indirect emissions across the firm’s value chain, including those from suppliers, product transportation, and end-of-life disposal. For the purposes of most BCA calculation, we focus on Scope 1 and Scope 2 emissions.
Only countries with an exposure higher than 0.001% are shown.
Bibliography
118th United States Congress, 2024a. Clean Competition Act of 2024, S.3342.
118th United States Congress, 2024b. MARKET CHOICE Act of 2024, H.R.6665.
Aguiar, A., Chepeliev, M., Corong, E., Van Der Mensbrugghe, D., 2022. The global trade analysis project (GTAP) data base: Version 11. J. Glob. Econ. Anal. 7.
Aldy, J.E., Burtraw, D., Fischer, C., Fowlie, M., Williams, R.C., Cropper, M.L., 2022. How is the U.S. Pricing Carbon? How Could We Price Carbon? J. Benefit-Cost Anal. 13, 310–334. https://doi.org/10.1017/bca.2022.19
Aldy, J.E., Stavins, R.N., 2012. The Promise and Problems of Pricing Carbon: Theory and Experience. J. Environ. Dev. 21, 152–180. https://doi.org/10.1177/1070496512442508
Assous, A., Burns, T., Tsang, B., Vangenechten, D., Schäpe, B., 2021. A storm in a teacup. Impacts and geopolitical risks of the European carbon border adjustment mechanism. Energy Found. China Httpswww Efchina OrgAttachmentsReportreport-Po-20210913E3G-Sandbag-CBAM-Pap.-Eng Pdf.
Böhringer, C., Balistreri, E.J., Rutherford, T.F., 2012. The role of border carbon adjustment in unilateral climate policy: Overview of an Energy Modeling Forum study (EMF 29). Energy Econ. 34, S97–S110.
Brandi, C., 2021. Priorities for a development-friendly EU Carbon Border Adjustment (CBAM). Briefing Paper.
Cassidy, B., Graham, G., 2024. Foreign Pollution Fee Act of 2024: Draft Copy of GAI24514 7YF.
Chang, J., 2025. Implementation of the EU carbon border adjustment mechanism and China’s policy and legal responses. Environ. Impact Assess. Rev. 110, 107683.
Clausing, K., Elkerbout, M., Nehrkorn, K., Wolfram, C., 2024. How Carbon Border Adjustments Might Drive Global Climate Policy Momentum.
Clausing, K.A., Wolfram, C., 2023. Carbon border adjustments, climate clubs, and subsidy races when climate policies vary. J. Econ. Perspect. 37, 137–162.
Condon, M., Ignaciuk, A., 2013. Border carbon adjustment and international trade: A literature review.
Congressional Research Service, 2025. U.S. Tariff Policy: Overview.
Cosbey, A., Droege, S., Fischer, C., Munnings, C., 2019. Developing guidance for implementing border carbon adjustments: lessons, cautions, and research needs from the literature. Rev. Environ. Econ. Policy.
Döbbeling-Hildebrandt, N., Miersch, K., Khanna, T.M., Bachelet, M., Bruns, S.B., Callaghan, M., Edenhofer, O., Flachsland, C., Forster, P.M., Kalkuhl, M., 2024. Systematic review and meta-analysis of ex-post evaluations on the effectiveness of carbon pricing. Nat. Commun. 15, 4147.
East, I.M.F.M., Dept, C.A., 2023. Morocco: Request for an Arrangement Under the Resilience and Sustainability Facility-World Bank Assessment Letter for the Resiliency and Sustainability Facility. IMF Staff Ctry. Rep. 2023, A002. https://doi.org/10.5089/9798400254963.002.A002
Edenhofer, O., Kalkuhl, M., 2011. When do increasing carbon taxes accelerate global warming? A note on the green paradox. Energy Policy 39, 2208–2212.
European Union, 2023. Regulation (EU) 2023/956 of the European Parliament and of the Council of 10 May 2023 establishing a carbon border adjustment mechanism.
Garsous, G., Mateo, M., Teusch, J., Theodoropoulos, K., Tricaud, A., Van Dender, K., 2023. Net effective carbon rates. Doc. Trav. OCDE Sur Fisc.
Government of Canada, 2025. The federal carbon pollution pricing benchmark.
Hasanbeigi, A., 2022. US Border Carbon Adjustment for Steel and Aluminum.
HM Treasury, Department for Energy Security & Net Zero, 2023. Factsheet: UK Carbon Border Adjustment Mechanism.
Hoel, M., 2012. Carbon taxes and the green paradox. Clim. Change Common Sense Essays Honour Tom Schelling 203–24.
Horowitz, J.K., Cronin, J.-A., Hawkins, H., Konda, L., Yuskavage, A., 2017. Methodology for analyzing a carbon tax. Department of the Treasury.
Hua, P.D., 2023. What Makes Border Tax Adjustment for CO 2 in the WTO So Controversial? The Example of the EU Proposal. Ex. EU Propos. April 25 2023.
Kell, A.J., McGough, A.S., Forshaw, M., 2020. Optimizing carbon tax for decentralized electricity markets using an agent-based model. Presented at the Proceedings of the Eleventh ACM International Conference on Future Energy Systems, pp. 454–460.
Marcu, A., Mehling, M., Cosbey, A., 2020. Border carbon adjustments in the EU: Issues and options. ERCST Roundtable Clim. Change Sustain. Transit.
Mehling, A.M.A.C.M., Svensson, A.M.S., 2024. The Use of CBAM Revenues.
Nystrom, S., Rorke, C., 2025. The Council’s Revenue Estimator for Pollution Fees. Climate Leadership Council. Observatory of Economic Complexity, 2024.
Pomerleau, S., 2025a. The New Foreign Pollution Fee Act. American Action Forum.
Pomerleau, S., 2025b. The 2025 Foreign Pollution Fee Act: Revenue Effect and Analysis. American Action Forum.
Pomerleau, S., 2023. Is the US Really a Global Leader in Low-Carbon Industry? Niskanen Center.
Pomerleau, S., 2021. How much net revenue would a border adjustment generate under a U.S. carbon tax? Niskanen Center.
Popp, D., 2019. Environmental policy and innovation: a decade of research.
Ramseur, J., Hite, K., Casey, C., 2024. Border Carbon Adjustments: Policy Considerations, Legislation, and Developments in the European Union.
Rasool, S., Reinsch, W.A., Denamiel, T., 2024. Crafting a Robust U.S. Carbon Border Adjustment Mechanism.
Rennert, K., Ho, M., Nehrkorn, K., Elkerbout, M., 2025. Projected Effects of the Foreign Pollution Fee Act of 2025. Resources for the Future.
Ruiz, M.A.G., 2023. The Achilles heel of border carbon adjustments: unintended effects on developing countries, in: Taxation and the Green Growth Challenge. Edward Elgar Publishing, pp. 69–83.
Sandler, E., Schrag, D.P., 2024. Leveraging Border Carbon Adjustments for Climate Finance: Matching Carbon Tax Assets.
Schivley, G., Azevedo, I., Samaras, C., 2018. Assessing the evolution of power sector carbon intensity in the United States. Environ. Res. Lett. 13, 064018.
The Economist, 2023. CBAM will force change in carbon-intensive sectors. The Economist.
The White House, 2025. America First Trade Policy.
The World Factbook, C., n.d. Country Comparisons – Exports.
Ursula von der Leyen, P. of the Eur.C., 2020. State of the Union Address.
U.S. Census Bureau, 2025. U.S. International Trade in Goods and Services (FT900).
World Bank, 2024. State and Trends of Carbon Pricing 2024. World Bank.
Sandler, Ely, Christine Jiang and Daniel Schrag. “The Revenue Potential and Country Exposure of a U.S. Border Carbon Adjustment.” Belfer Center for Science and International Affairs, June 2, 2025