Executive Summary
Background: Electrification through heat pumps is a primary strategy for decarbonizing residential heating in Massachusetts. The state has announced ambitions for 65% of residential-scale heating to be heat pump equipment by 2030 and 90% by 2040, earmarking nearly 4 billion dollars in incentives between 2022 and 2024 to promote uptake. Yet high electricity prices across the state (among the highest in the country) mean that heat pump adoption will increase household heating bills and energy burdens, preventing widespread uptake. Here, we undertake a comprehensive spatial analysis of the effect of heat pump adoption on residential household heating costs in Massachusetts across a range of heating types and fuel costs. Our aim is to identify where heat pump adoption should be prioritized and where policy, financial, or other measures will be necessary to promote uptake.
Analysis: We calculate the annual change in residential heating costs incurred by the average Massachusetts household (1,800 sq ft) converting from natural gas, oil, or electric resistance heating to an air- or ground-source (geothermal) heat pump. We conduct our analysis on a town-by-town basis, using location-specific fuel and electricity costs and heat pump coefficient of performance (COP) values.
Results: In approximately 50% of households in the state, predominately those heated with natural gas, air-source heat pump adoption would increase annual household heating costs, in most cases, by $300–$500 per year. The exception is in regions where electricity prices are substantially lower than the state average. In these households, along with households heated with oil (around 25% of all households), air-source heat pump adoption would reduce annual heating bills, but these savings are small relative to installation costs. In households currently using electric resistance heating, air-source heat pump adoption will decrease annual heating costs, in some cases up to $2,900 per year (for the average-sized MA household). The high annual savings for households with electric resistance heating mean that upfront heat pump purchase and installation costs can typically be recovered in much less than ten years, even without subsidies.
Conclusions: We recommend that state policies to promote heat pump adoption initially focus on the 16% of Massachusetts households with electric resistance heating, where the cost of heat pump installation can be recovered quickly. Obstacles in these households will likely be associated with financing as many of these are rental households where landlords have little incentive to upgrade heating systems. For households with oil heating, savings are marginal and therefore not enough to make heat pump adoption cost-effective. These households could be a secondary target for subsidies, particularly those households with central air conditioning that will, at some point, require replacement. Decarbonizing residential heating across all households will require a substantial decrease in the residential price of electricity relative to natural gas or oil to make heat pump adoption more widely cost-effective.
Background
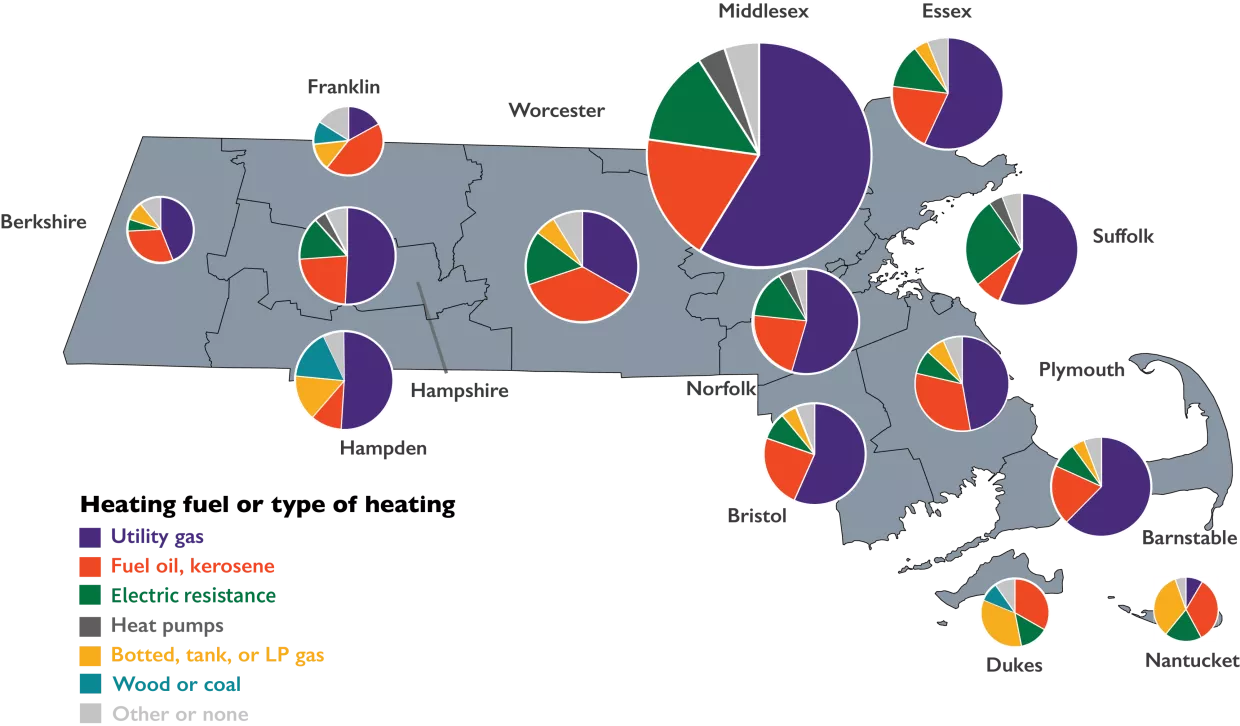
Residential heating accounts for approximately 16% of Massachusetts’ direct greenhouse gas emissions (12.2 million metric tons/year),1 primarily from natural gas and oil, the dominant heating sources of households in the state (Figure 1). The state’s Clean Energy Climate Plan outlines goals to decarbonize residential heating through electrical efficiency updates and electrification (i.e., heat pumps) with ambitions to install heat pumps in 2.2 million households by 2050.2 To help reach these goals, the state has dedicated approximately $4 billion through its Mass Save program, primarily as subsidies to help cover the upfront costs of heat pump purchase and installation. This is in addition to federal tax credits made available through the 2022 Inflation Reduction Act. The transition to heat pumps has been further bolstered by the Massachusetts Department of Public Utilities’ (DPU) recent order, which stated that gas utilities are required to consider non-gas alternatives and will no longer be able to recover costs associated with programs that promote the use of natural gas through ratepayers.3 The DPU indicated that there must be a significant increase in the adoption of heat pumps but that customer costs must be minimized.
The high electricity prices in Massachusetts, the third most expensive in the country,4 may present a barrier to widespread heat pump uptake if adoption causes heating bills to increase. Whether annual heating bills increase with heat pump adoption depends on factors such as the incumbent heating type (natural gas, oil, or electricity), the price of heating fuels and electricity, and heat pump efficiency. In some cases, for instance in homes with electric resistance heating, heat pump adoption may substantially reduce annual energy bills due to the increased efficiency of heat pumps relative to electric resistance space heating. In this study, we aim to identify the households and regions where heat pump adoption may increase heating bills and where there may be opportunities for cost savings.
Here we undertake a spatial analysis of the annual change in residential heating costs for Massachusetts households that convert from natural gas, oil, or electric resistance heating to air- or ground-source heat pumps. Our analyses are based on the average-sized Massachusetts household, which is 1,800 sq ft5 and consumes approximately 13,000–15,000 kWh of energy annually for heating.6 We conduct our analyses on a town-by-town basis, using current natural gas, heating oil, and electricity costs (as of April 2024) and average monthly temperature records (2010– 2022)7 to determine heat pump efficiency (the coefficient of performance) over the heating season (September–May). We estimate heat pump purchase and installation costs to be approximately $20,000 for air-source heat pumps for an average-sized household, with an additional $20,000 for ground-source heat pump installation.8,9 We present our results by incumbent heating technology and discuss findings in the context of cost-effective heat pump uptake, natural gas demand, greenhouse gas emissions, and climate adaptation.
Results
Natural gas
Natural gas is the primary residential heat source in Massachusetts, used in approximately half of all households in the state (~1.4 million households: Figure 1). Over the heating season, which runs from September to May (inclusive), an average-sized household unit in Massachusetts (~1,800 sq ft) pays approximately $910–$1,190 for natural gas heating, based on natural gas costs between 6.7¢ and 9.1¢/kWh (Table S1) and an annual heating energy consumption of 13,000 kWh.6
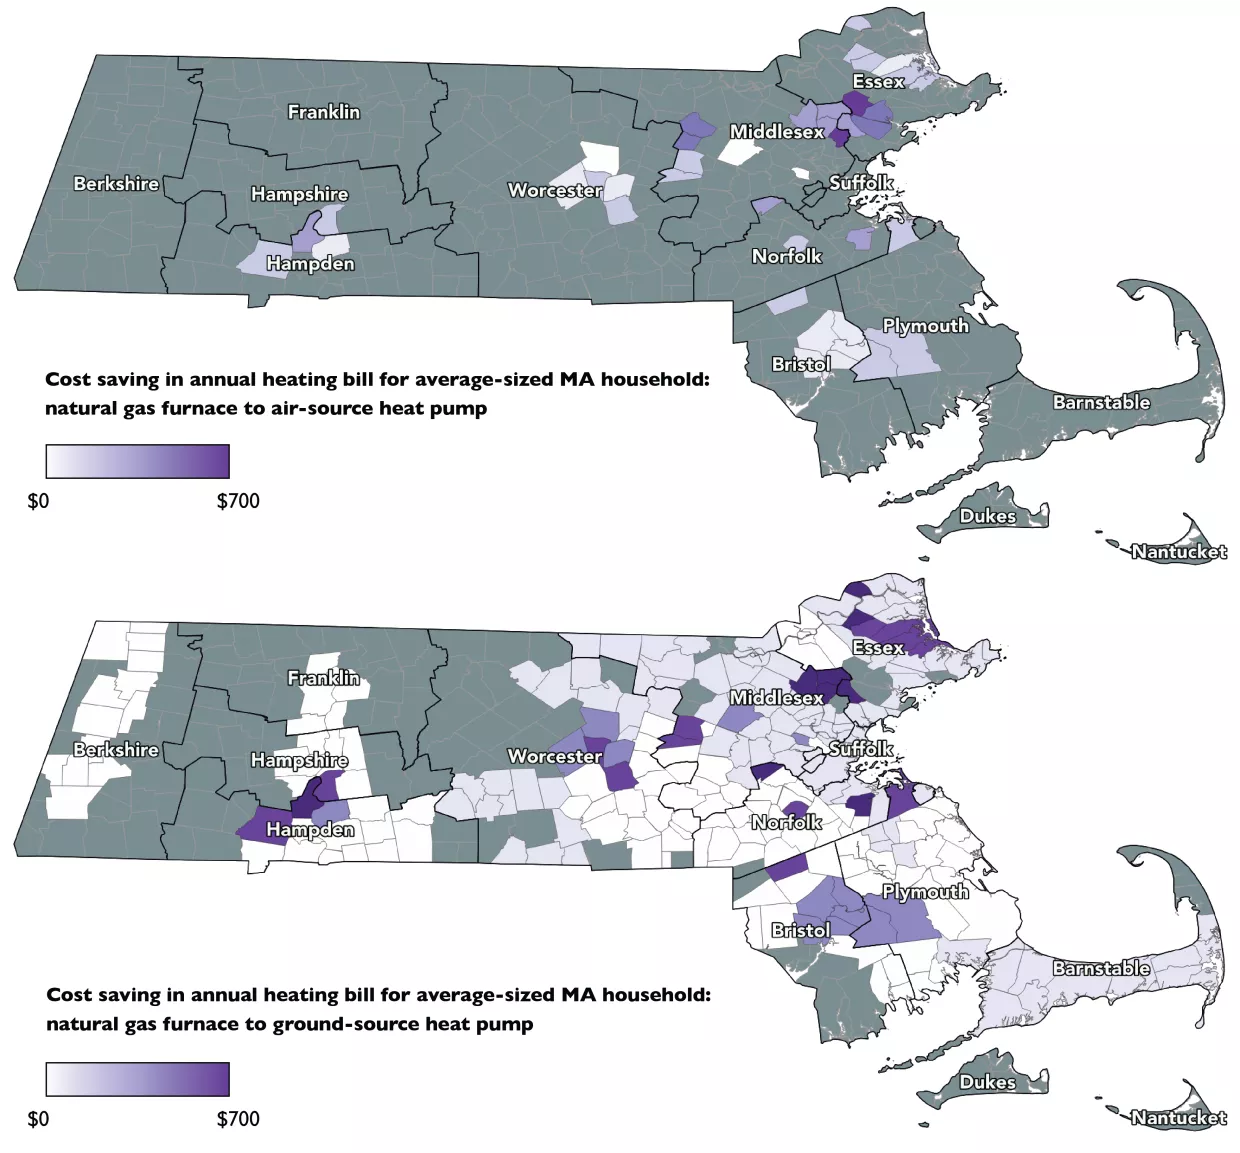
By adopting an air-source heat pump system in place of a natural gas furnace, approximately 156,000 households (6% of all households) incur a reduction in annual heating bills, saving up to $700 per year in some cases (Figure 2). These greater saving opportunities are restricted to towns or cities where municipalities provide electricity at lower prices than the state average electricity costs of 33¢/ kWh (e.g., Ashburnham, Berkley, Boylston). There are marginal cost savings in other regions covered by investor-owned utilities, but only if customers seek a competitive power supply lower than the average utility rate. In all other areas with utility gas (approximately 1.25 million households), adopting air-source heat pumps would significantly increase heating costs—in some cases, up to $1,000 per year (Table A1).
The opportunities for annual cost savings are wider with ground-source heat pumps (~975,000 households), given their superior efficiency compared with air-source heat pumps (coefficient of performance ~4, compared with 2-3 for air-source heat pumps, Table A1). Further, provided they are installed at sufficient depth (~9m), ground-source heat pump efficiency does not fluctuate over air temperature variations, meaning that cost savings would be distributed across the year, unlike air-source heat pumps in which savings, on a per unit energy basis, would be greater in warmer months. Nonetheless, annual savings are still marginal (less than $100 annually) in most regions (Figure 2 and Table A1) and only benefit these additional regions if large utility customers choose their power supply at a lower cost than the average price of electricity provided by the utility.
Heating oil
Following natural gas, heating oil is the leading fuel source for residential heating in MA, particularly in counties where the gas grid does not provide full coverage, such as Worcester and Franklin (Figure 1). Depending on the county, heating oil costs approximately 8.8¢ – 9.2¢ per kWh, totaling $1,370–$1,435 over the heating season. The greater costs are also partly due to the lower average efficiencies (~80%) of oil furnace heating.10
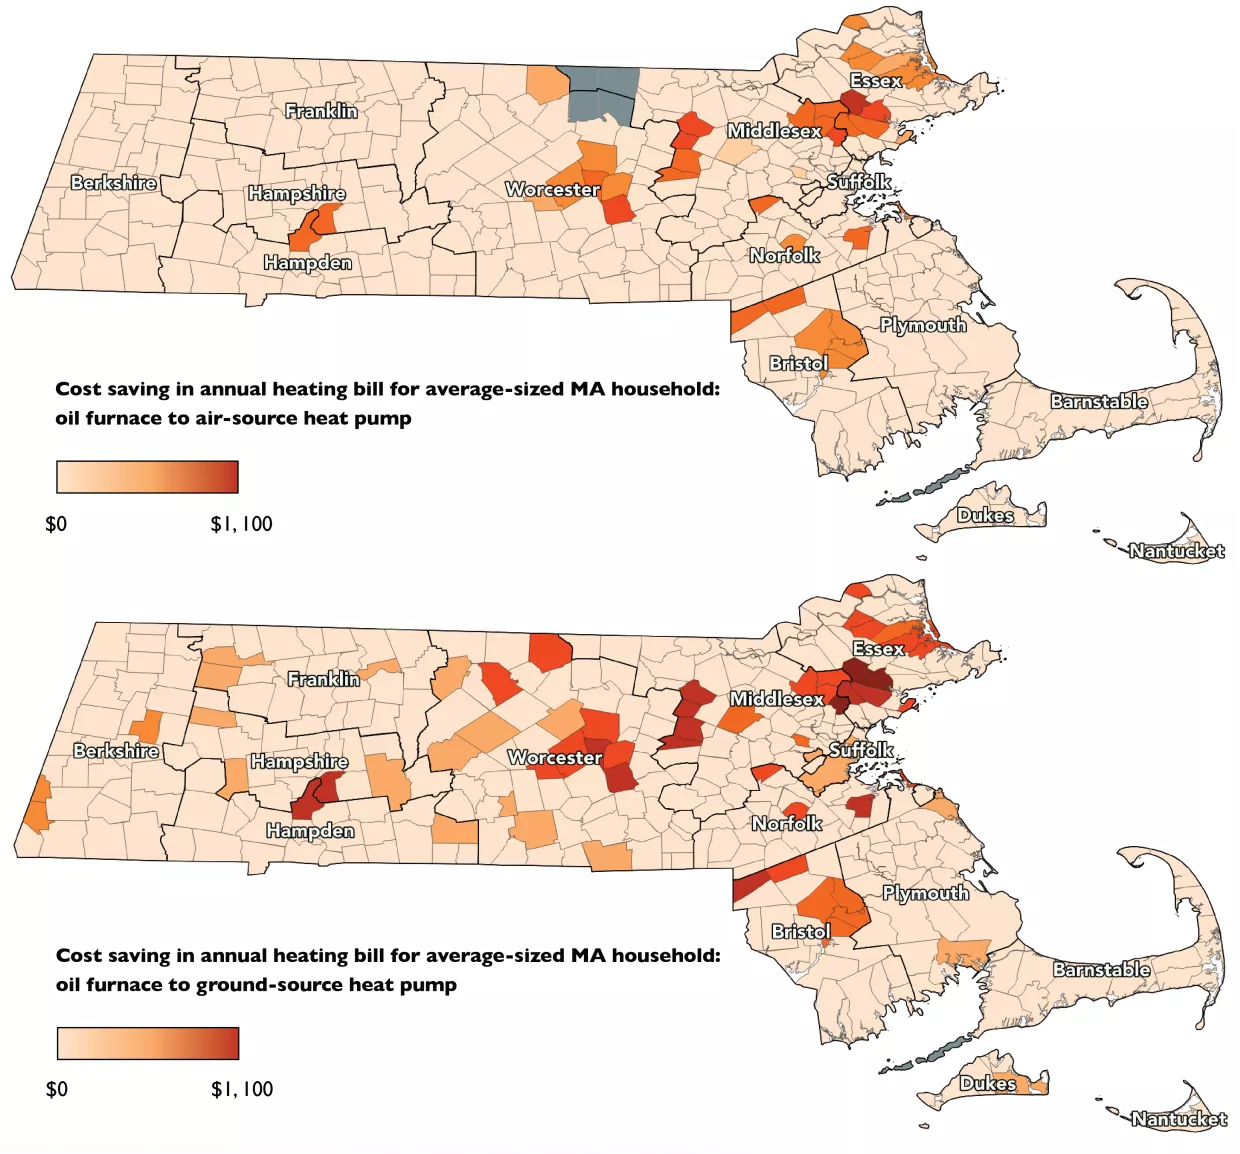
Given the greater cost of heating oil relative to natural gas (~9¢/kWh versus ~6.7¢/ kWh), opportunities for cost savings with air-source heat pump adoption are more widespread compared with natural gas heating systems—although these savings are still marginal, averaging ~$100 per year (Figure 2). With air-source heat pumps, approximately 655,000 households would incur a reduction in heating bills, representing a quarter of all households in the state. As with natural gas, the greatest savings (up to $1,100 per year) are in towns or cities with lower electricity costs than the prevailing state average (Table A1). Again, in regions served by large utilities, these savings are only possible if consumers purchase power from a different competitive supplier and not at the base rate provided by the utility (although the utility still provides delivery, which can represent more than half the total cost per kWh). With ground-source heat pumps, which are more efficient, approximately 680,000 households would incur a saving in annual heating costs (Figure 3), but again these are mostly marginal savings.
Electric resistance heating
Approximately 16% of households in Massachusetts use some form of electrical resistance heating, typically as in-built baseboard or space heating, with the greatest use in Middlesex (22.5%), Suffolk (22%), and Worcester (13.4%) counties (Figure 1).11 Electric heating systems dominate in low-income, multi-unit housing due to the low upfront capital costs relative to other heating systems, averaging ~$250–500 for installation12 (not including labor costs). Yet operating costs are much higher: an average-sized household unit (1,800 sq ft) with electric resistance heating pays approximately $4,290 annually at the prevailing average electricity costs across the state (33¢/kWh), although costs will be less in smaller households.
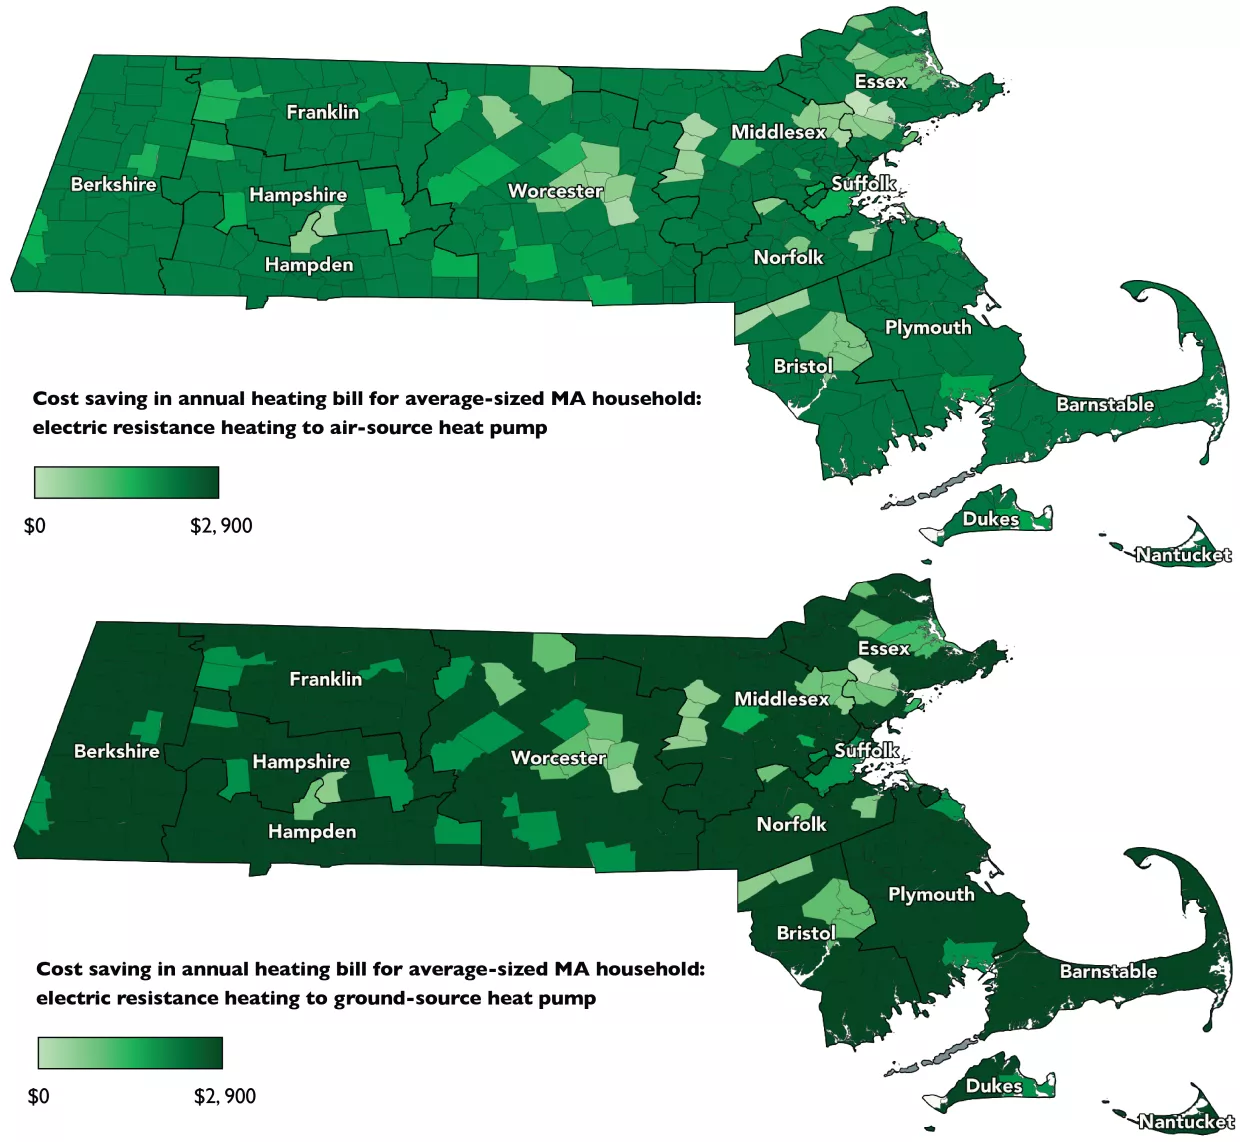
Given heat pumps’ superior efficiency in converting electrical energy to thermal energy, all Massachusetts households that currently use electric resistance heating as their primary heating source (~420,000) incur cost savings by converting to an air- or ground-source heat pump, with greater annual savings in towns or cities that have higher heat pump coefficient of performance values (Table A1) or more expensive electricity. In some ways, the situation is reversed from heating oil or natural gas heat; households in towns with more expensive electricity and with electric resistance heating systems will save more switching to heat pumps than those in towns with less expensive electricity. Annual savings range from $66–$2,484 for an air-source heat pump, increasing to ~$2,787 per year for ground-source heat pumps (Figure 4). Additional research is needed to provide detail on the households that use electric resistance heat, but many are likely to be low-income households and, in particular, rental households, as landlords may choose the lowest capital cost for heating systems if they are not directly benefitting from lower operational costs. So even though the large cost savings for switching to heat pumps should have already driven a change, the large number of households that still use electric resistance heat suggests that a major challenge exists in financing the upfront capital costs, as the savings may not accrue to the property owners.
Discussion
Cost-effective opportunities for heat pump adoption in Massachusetts
In this study, we conduct a spatial analysis of the impact of heat pump adoption on annual heating costs for an average-sized Massachusetts household that currently uses natural gas, oil, or electric resistance heating. Our analysis shows that at current (April 2024) electricity and fuel costs, approximately 50% of Massachusetts households, primarily those heated with natural gas, would incur an increase in annual heating bills with air-source heat pump adoption. The exceptions to this are households in towns where the cost of electricity is lower than the state average, resulting in annual cost savings with heat pump adoption. With ground-source heat pump adoption, opportunities for cost savings are more widespread; however, these are typically marginal at <$200 per year. In these cases, and in households that are currently heated with oil, the marginal annual savings through heat pump adoption will necessitate subsidies to reduce upfront capital costs for consumers since annual bill savings will be insufficient to recover high capital costs (approximately $20,000 for an air-source heat pump in Massachusetts8,9) in a reasonable time frame.
In contrast, high annual savings with air-source heat pump adoption (up to approximately $2,500) enable the 16% of households using electric resistance heating to recover upfront heat pump purchase and installation costs in less than ten years, even without subsidy support. Subsidies will still be necessary to cover capital costs in smaller households with lower annual cost savings and in scenarios where there may be financing issues (e.g., in low-income or rental housing).
Taken together, we suggest that policies and financial incentives should primarily focus on promoting heat pump adoption in households that would reduce or not change their heating bills by switching to a heat pump. Households with electric resistance heating should be the primary target for state policies, as the potential savings from switching to heat pumps are already high enough to justify switching without any subsidies, although subsidies may still be necessary to deal with other market failures discussed above. Subsidies should also focus on the opportunities where heat pump adoption does not increase bills, or incurs marginal savings, but where savings are too small to recover upfront costs in a reasonable time frame. Decarbonizing the remaining households that use natural gas or oil in regions with high electricity prices will require a substantial decrease in the residential price of electricity relative to natural gas or oil to make heat pump adoption cost-effective.
Reducing demand for natural gas and greenhouse gas emissions
Maintaining a reliable natural gas supply is a critical energy concern for Massachusetts. In recent years, the state has faced high winter gas price volatility, partly due to shortages in supply, among other factors. Heat pumps are seen as a potential means of mitigating these issues by reducing the overall demand for natural gas.
If all households in the state convert to an air-source heat pump, there would be a marginal 11.49 trillion BTU increase in natural gas demand, equivalent to approximately 1% of MA’s annual natural gas consumption.13 Although overall natural gas demand would reduce if households with natural gas furnaces and electric resistance heating switched to heat pumps, the additional electricity demand from households previously heated with oil increases the overall demand as generation in the state remains dominated by natural gas. These changes in fossil fuel consumption would reduce CO2 emissions by approximately 2 million metric tons (MMT) per year (16% of residential buildings heating emissions14), most of which are due to the reduction in heating oil usage. In all scenarios, natural gas and emissions savings are greater with the adoption of ground-source heat pumps due to their greater efficiencies. In addition, as the Massachusetts grid becomes decarbonized, emissions savings will increase.
The marginal reductions in natural gas demand with heat pump adoption suggest that the state should seek other strategies to reduce its total demand for natural gas, such as improvements to infrastructure to reduce losses or decarbonization of the power grid with renewables. Heat pumps remain a critical strategy for decarbonizing the residential heating sector.
Air conditioning and adaptation to extreme heat
Around one-third of households in the state currently have central air conditioning.15 Updating these systems on a cycle of ~20 years could be a cost-effective strategy for addressing the upfront expenses of heat pumps. 53% of households in the state have room or window air conditioning, and 10% do not have any form of air conditioning. With climate change, Massachusetts is expected to experience an increase in the number of days with extreme heat (over 90°F). Therefore, heat pump adoption offers an adaptation strategy to extreme heat, particularly in lower-income households, as they can also be used for cooling.
Conclusions and Recommendations
1. Heat pump adoption should be prioritized in the 16% of Massachusetts households (~420,000) with electric resistance heating, where installation costs can be recovered in 10 years or less. Subsidies should be focused on overcoming challenges with rental housing, where savings in operating costs may not accrue to owners.
2. Subsidies for heat pump installations in households heated with natural gas or oil should target communities that pay lower overall prices for residential electricity and would not incur any increase in heating bills by switching to heat pumps. Opportunities for cost-effective heat pump adoption are greater in households heated with oil than natural gas. Even in these households, savings in operating costs will rarely be sufficient to make heat pump adoption cost-effective without subsidies, although there is potential to couple heat pump installation with the replacement of air conditioning units to defray some capital costs.
3. Decarbonizing residential heating at scale will require a substantial decrease in the cost of electricity relative to natural gas or oil to make heat pump adoption cost-effective. For most households in Massachusetts that use natural gas or oil heating, heat pumps either raise annual heating bills or offer only marginal savings due to high electricity costs. Thus, complete decarbonization of building heating through electrification will require substantial changes in electricity pricing to bring down costs.
Data Sources
Heat pump coefficient of performance
Air-source heat pump coefficient of performance (COP) values, the ratio of useful heating to heat pump energy requirements, were based on the empirical relationship between COP and outside air temperature.16 Average heating season air temperatures were calculated for each town based on NOAA average monthly temperature normals between 2006 and 2020,7 weighted to the number of heating degree days (the difference between the daily temperature mean and 18.3°C).
For ground-source heat pumps, COP values were based on the relationship between ground temperature and COP at different inlet temperatures,17 assuming an inlet temperature of ~20°C above an inside air temperature of 20°C. For ground temperature, non-degree day weighted annual average air temperatures, calculated from the NOAA average monthly temperature normals, were used as a proxy.
Residential electricity, natural gas, and oil prices
Residential gas and electricity prices were obtained from current (April 2024) rate tariffs published by the main investor-owned utilities (Eversource, Berkshire Gas Company, Liberty Utilities, National Grid, Unitil) and municipal companies (Holyoke Gas & Electric, Middleborough Gas & Electric, Wakefield Municipal Gas & Light, Westfield Gas & Electric, among others). For utilities where residents can choose their own power supply, supply rates for independent providers were obtained from FindEnergy.com. Prices were assigned to each town based on service area information provided by the Massachusetts Department of Public Utilities.18 Average county-level heating oil prices were obtained from NewEnglandOil.com.
Annual savings to heating costs
Annual heating costs were based on an average-sized Massachusetts household of 1,800 sq ft,15 taking the state average annual energy consumption of 13 MWh for heating.6 A fuel efficiency of 90% was assumed for natural gas heating and a lower efficiency of 80% for oil-based heating, as these systems are typically older and therefore less efficient.10 Data on primary household heating type by county were obtained from the American Community Survey undertaken in 2022.11 In the absence of empirical data, the number of households with each heating type by town was estimated using the total number of households per town19 and the percentage of heating types by county.9
Natural gas demand and CO2 emissions
The potential change in natural gas demand with air-source heat pump adoption was calculated based on state-level data on consumption of natural gas, oil and electricity for space heating collected in the 2020 Energy Information Administration Residential Energy Consumption Survey.20,21,22 Our calculation assumes that all additional electricity demand with heat pump adoption is met using natural gas, since electricity production is dominated by natural gas in Massachusetts.23 In this calculation, we used an average natural gas power plant efficiency of 46%, calculated using Massachusetts’ 2023 annual natural gas consumption for electric power generation (109,583 MMcf)13 and 2023 state-level total electric power generation (14,850,080 MWh).24 To calculate CO2 emissions reductions, we used a natural gas emissions intensity of 52.91 kg/mmbtu and 74.14 kg/mmbtu for residential heating oil.25
Shafiee, Roxana and Daniel Schrag. “Opportunities for Cost-Effective Residential Heat Pump Adoption in Massachusetts.” June 26, 2024
- Mass.gov (2024). Massachusetts Climate Report Card - Buildings Decarbonization. Available at: https://www.mass.gov/info-details/massachusetts-climate-report-card-buildings-decarbonization#:~:text=The%20Buildings%20sector%20is%20the,hot%20water%2C%20and%20other%20appliances
- Mass.gov (2024). Massachusetts Clean Energy and Climate Plan for 2025 and 2030. Available at: https://www.mass.gov/doc/clean-energy-and-climate-plan-for-2025-and-2030/download
- Massachusetts Department of Public Utilities (2023). D.P.U. 20-80-B: Investigation by the Department of Public Utilities on its own Motion into the role of gas local distribution companies as the Commonwealth achieves its target 2050 climate goals. Available at: https://fileservice.eea.comacloud.net/FileService.Api/file/FileRoom/18297602
- Energy Information Administration (2024). Table 5.6.A. Average Price of Electricity to Ultimate Customers by End-Use Sector, by State, January 2024 and 2023 (Cents per Kilowatthour). Available at: https://www.eia.gov/electricity/monthly/epm_table_grapher.php?t=epmt_5_6_a
- Realtor.com (2022). Housing Inventory: Median Home Size in Square Feet in Massachusetts. Available at: https://fred.stlouisfed.org/series/MEDSQUFEEMA
- Energy Information Administration (2023). 2020 RECS Survey Data: CE3.1ST Annual household site end-use consumption in United States homes by state—totals and averages, 2020. Available at: https://www.eia.gov/consumption/residential/data/2020/state/pdf/ce3.1.st.pdf
- National Oceanic and Atmospheric Administration (2023). US Climate Normals: 15-Year Normals (2006–2020). Available at: https://www.ncei.noaa.gov/products/land-based-station/us-climate-normals
- Massachusetts Clean Energy Center (2021). Masscec Pilot Showcases Success Of Whole Home Heat Pumps. Available at: https://www.masscec.com/blog/masscec-pilot-showcases-success-whole-home-heat-pumps
- Mass Save (2024). Air Source Heat Pumps. Available at: https://www.masssave.com/en/residential/rebates-and-incentives/heating-and-cooling/heat-pumps/air-source-heat-pumps#cost-part-three-foot
- Energy.gov (n.d.). Furnaces and Boilers. Available at: https://www.energy.gov/energysaver/furnaces-and-boilers
- U.S. Census Bureau (2022). House Heating Fuel. American Community Survey, ACS 1-Year Estimates Detailed Tables, Table B25040, 2022. Available at: https://data.census.gov/table/ACSDT1Y2022.B25040?q=B25040: HOUSE HEATING FUEL massachusetts&g=010XX00US,$0400000&d=ACS
- ForbesHome (2024). How Much Does An Electric Baseboard Heater And Installation Cost? Available at: https://www.forbes.com/home-improvement/hvac/electric-baseboard-heater-cost/#:~:text=Expect%20prices%20between%20%24250%20and,%24300%20to%20the%20project%20cost
- Energy Information Administration (2023). Natural Gas Consumption by End-Use: Massachusetts. Available at: https://www.eia.gov/dnav/ng/ NG_CONS_SUM_DCU_SMA_A.htm
- Mass.gov (2023). Massachusetts Climate Report Card. Available at: https://www.mass.gov/report/massachusetts-climate-report-card
- Navigant (2019). Massachusetts Residential Baseline Study. Available at: https://ma-eeac.org/wp-content/uploads/RES-1-Residential-Baseline-Study-Comprehensive-Report-2019-04-30.pdf
- Gibb, D. et al (2023). Coming in from the cold: Heat pump efficiency at low temperatures. Joule, 7 (9), 1939-1942.
- Sarbu, I., & Sebarchievici, C. (2018). A comprehensive review of thermal energy storage. Sustainability, 10 (1), 191.
- Mass.gov (2024). Find My Electric, Gas, and Water Company. Available at: https://www.mass.gov/info-details/find-my-electric-gas-and-water-company
- U.S. Census Bureau (2022). Selected Social Characteristics in the United States. American Community Survey, ACS 1-Year Estimates Data Profiles, Table DP02, 2022. Available at: https://data.census.gov/table/ACSDP1Y2022. DP02?q=massachusetts households&g=010XX00US.
- Energy Information Administration (2023). CE4.1EL.ST – Electricity by end use by state - totals. Available at: https://www.eia.gov/consumption/residential/ data/2020/state/pdf/ce4.1.el.st.pdf
- Energy Information Administration (2023). CE4.1NG.ST – Natural gas consumption by end use by state-totals. Available at: https://www.eia.gov/consumption/residential/data/2020/state/pdf/ce4.1.ng.st.pdf
- Energy Information Administration (2023). CE4.1FO.ST – Fuel oil consumption by end use by state – totals. Available at: https://www.eia.gov/consumption/residential/data/2020/state/pdf/ce4.1.fo.st.pdf
- Energy Information Administration (2024). Massachusetts State Profile and Energy. Available at: https://www.eia.gov/state/?sid=MA#tabs-4
- Energy Information Administration (2023). State-level generation and fuel consumption data (EIA-Form 923). Available at: https://www.eia.gov/electricity/data.php#generation
Energy Information Administration (2023). Carbon Dioxide Emissions Coefficients. Available at: https://www.eia.gov/environment/emissions/co2_vol_mass.php
Table A1 (Download PDF report to view). Change in annual heating costs through air- and ground-source heat pump adoption in Massachusetts by town, based on incumbent heating type. Additional information included relating to the coefficient of performance value (COP) for both air- and ground-source heat pumps and the current (April 2024) residential price of heating fuel (natural gas, oil) and electricity, in ¢/kWh. In towns served by the large investor-owned utilities Eversource and National Grid, electricity costs represent average costs across all potential independent energy supply companies that consumers may choose (with delivery provided by the utility). Electricity costs can vary depending on whether consumers opt for a competitive energy supply, and therefore, some consumers may incur cost savings while other consumers incur additional costs through heat pump adoption. To account for this, 1 represents the average of consumers receiving cost savings, and 2 represents the overall average of all consumers served in each town.


